


After closing June near the $2,470 mark, Ethereum Price Action will be compressed towards July under the descending resistance line and visible supply zone. The broader technical drawing shows neutral momentum, with prices trying to stabilize beyond the 20-day EMA, while liquidity accumulation suggests that a major move this month is likely.
Ethereum price forecast for July 2025
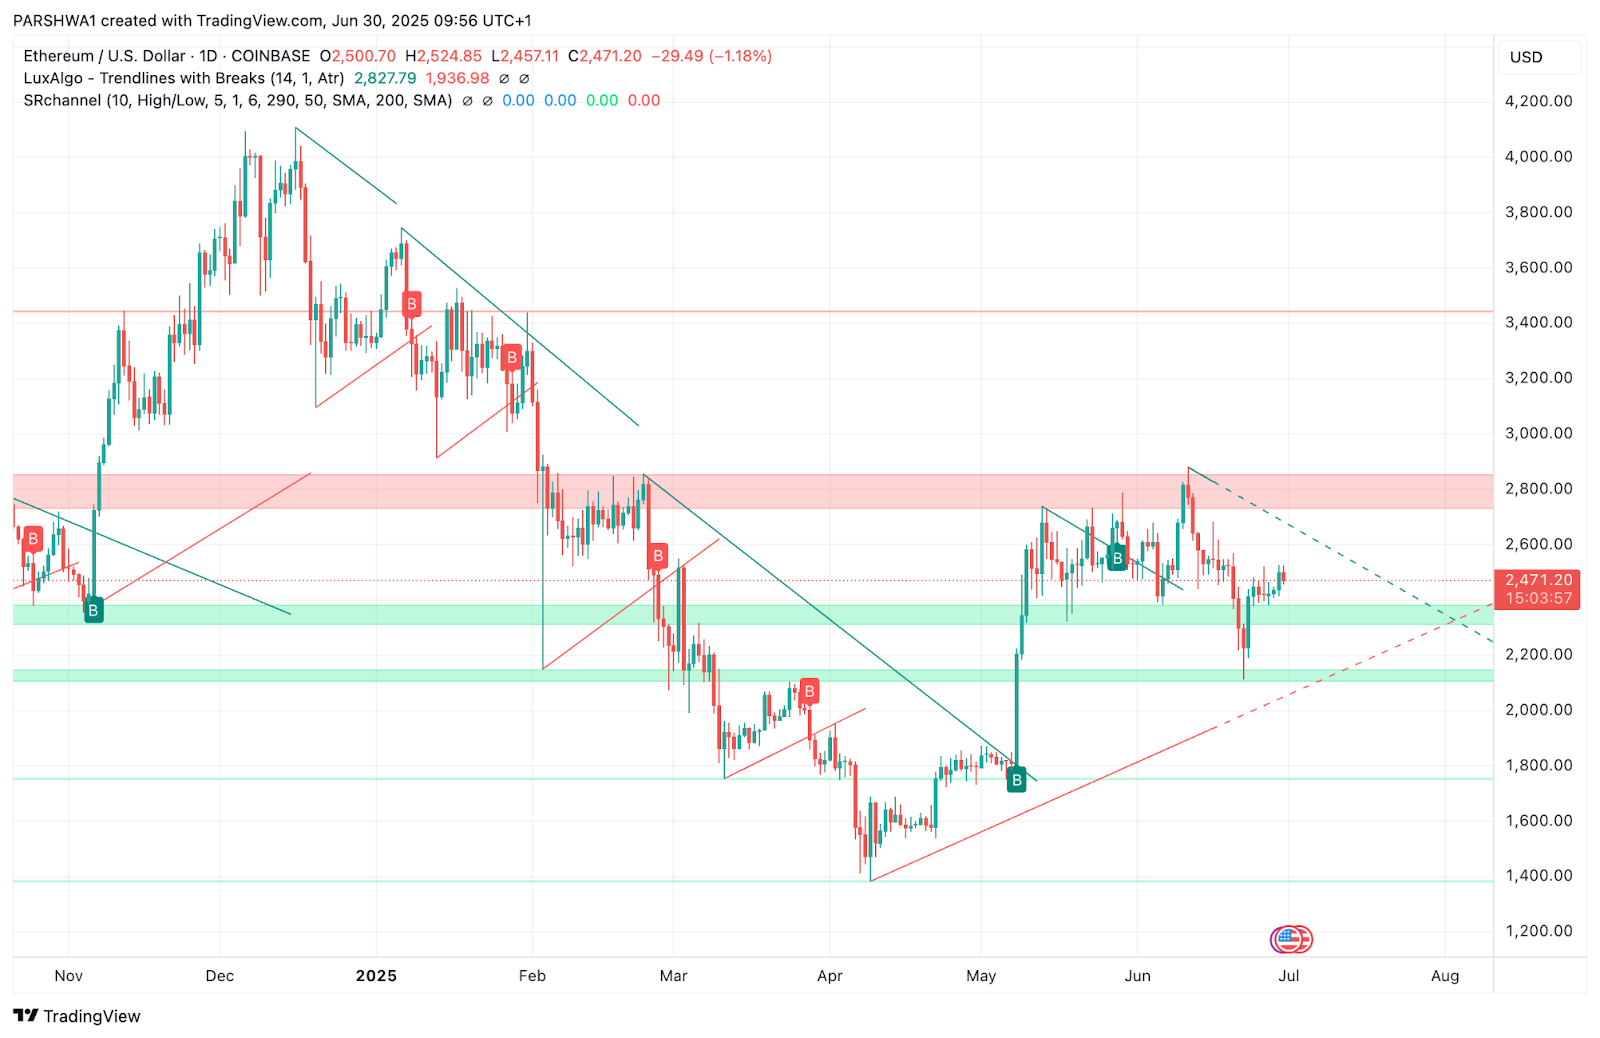
ETH Price Dynamics (Source: TradingView)
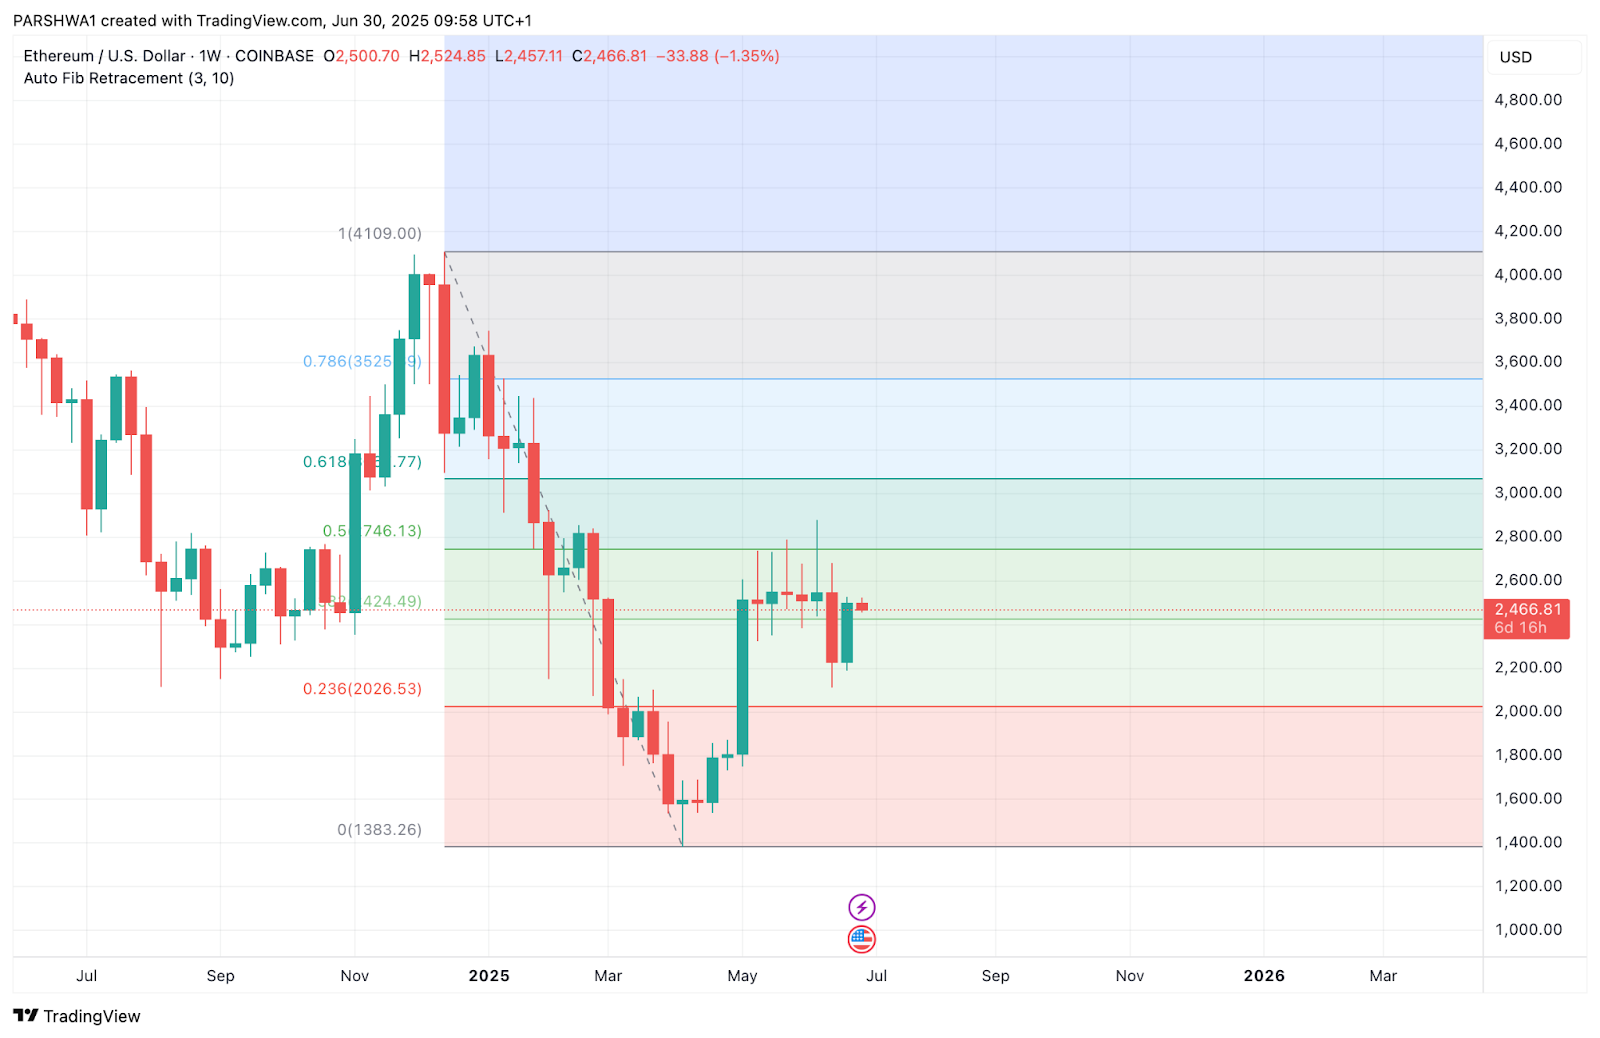
Ethereum trades just under the critical resistance region between $2,500 and $2,600, and overlaps with the 0.382 Fibonacci retracement from the lows of November 2024 to April 2025. The current structure remains in the range between $2,300 and $2,600, with prices lowering under the downward trend that closes previous gatherings since June 15th.
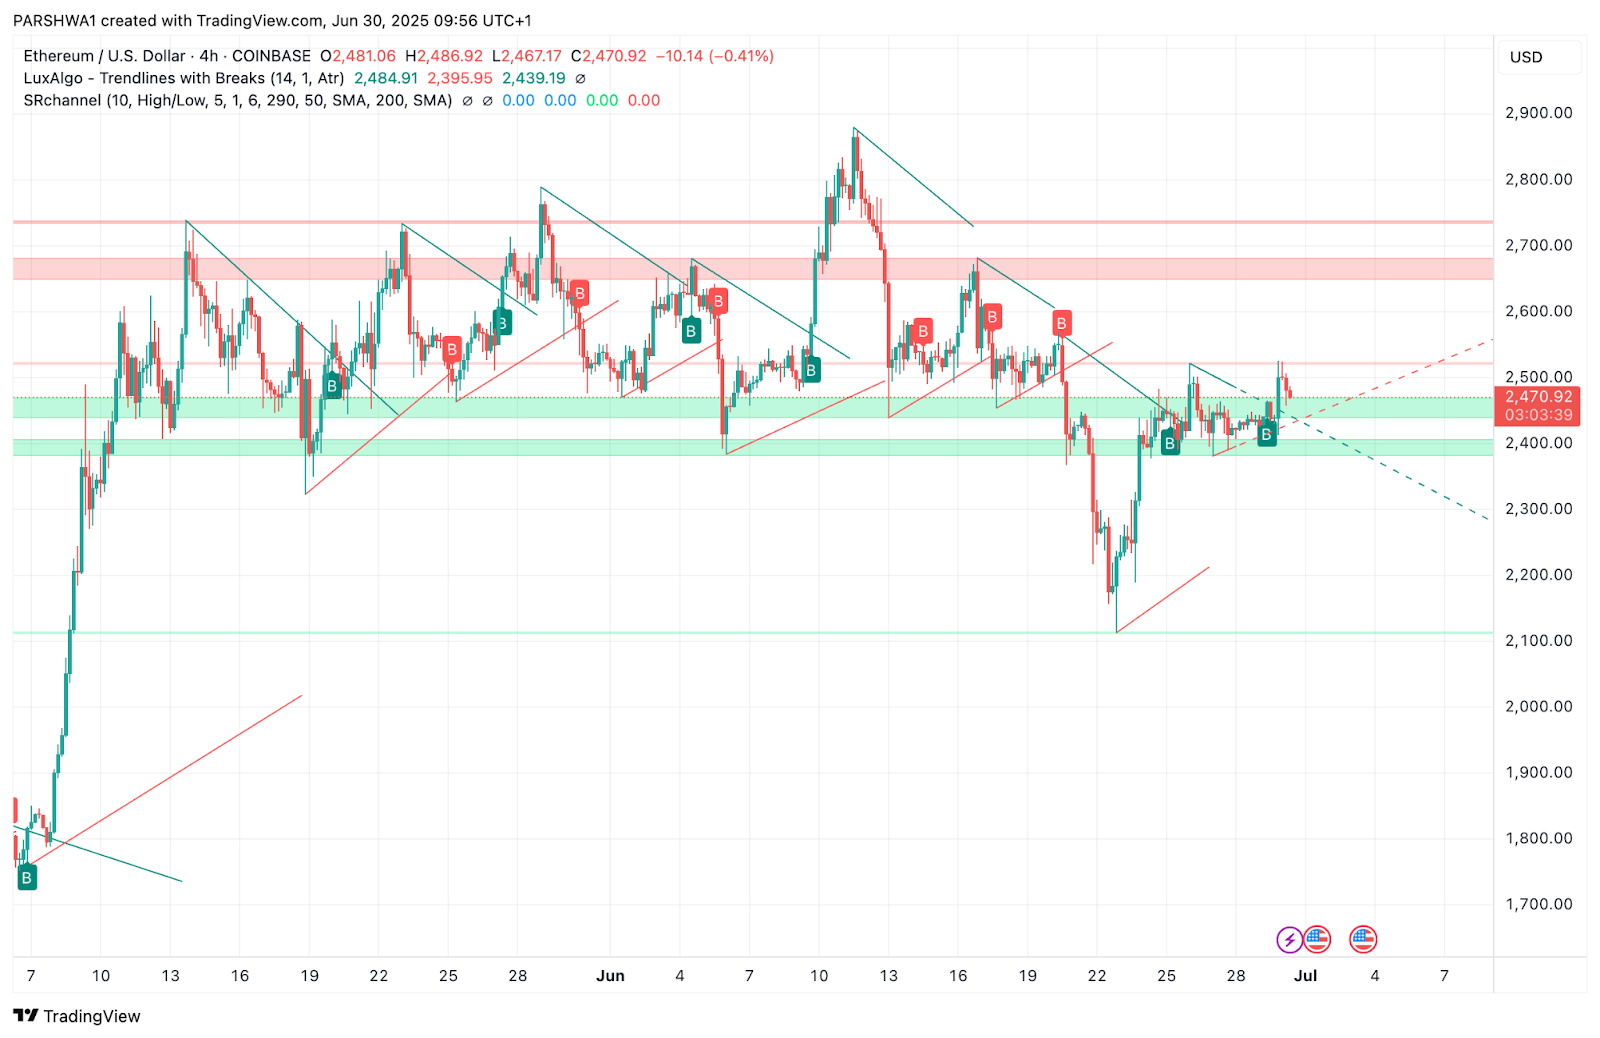
ETH Price Dynamics (Source: TradingView)
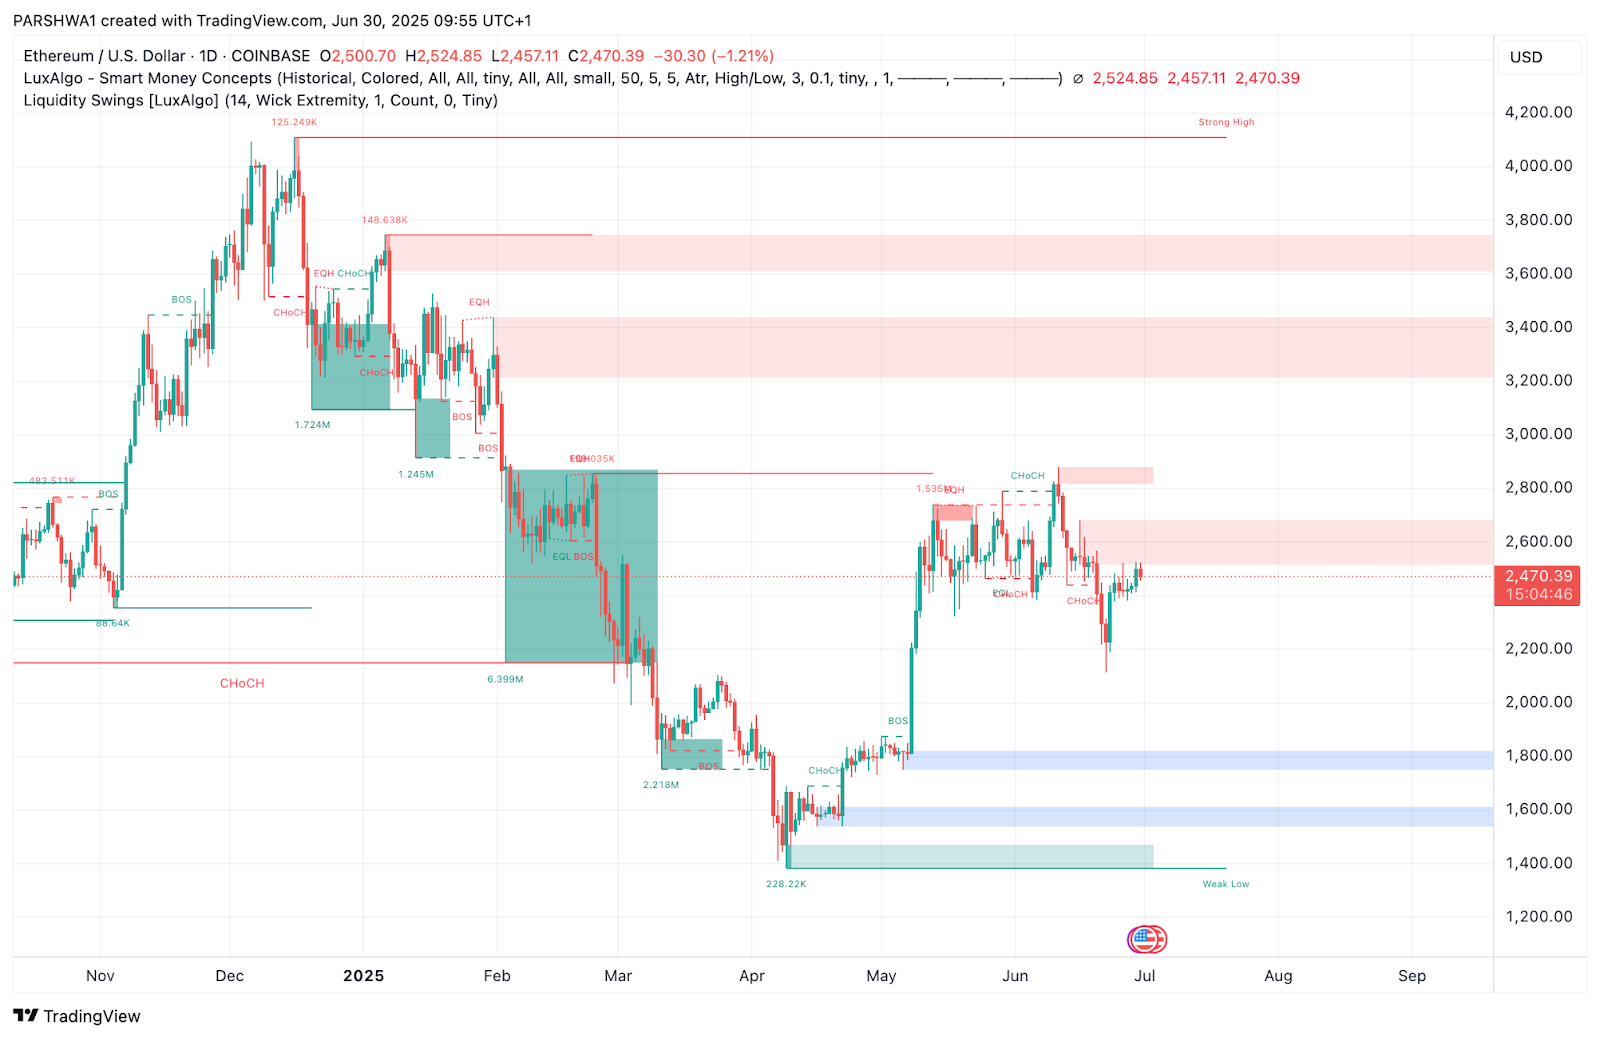
The Smart Money Concepts (SMC) chart shows multiple Choch and BOS points close to $2,250-$2,500, indicating active liquidity engineering. There is a visible order block of around $2,600 that you have to violate to verify a sustained bullish breakout, but if you can't go beyond $2,400, you could potentially steer a June low of under $2,200 at $2,050.
The Ethereum trajectory will depend heavily on whether the Bulls can push over the triangular resistance, regaining $2,600 and targeting the next Fibonacci level around $2,746.
ETH Price Indicators, Signals, and Charts (1M)
ETH Price Dynamics (Source: TradingView)
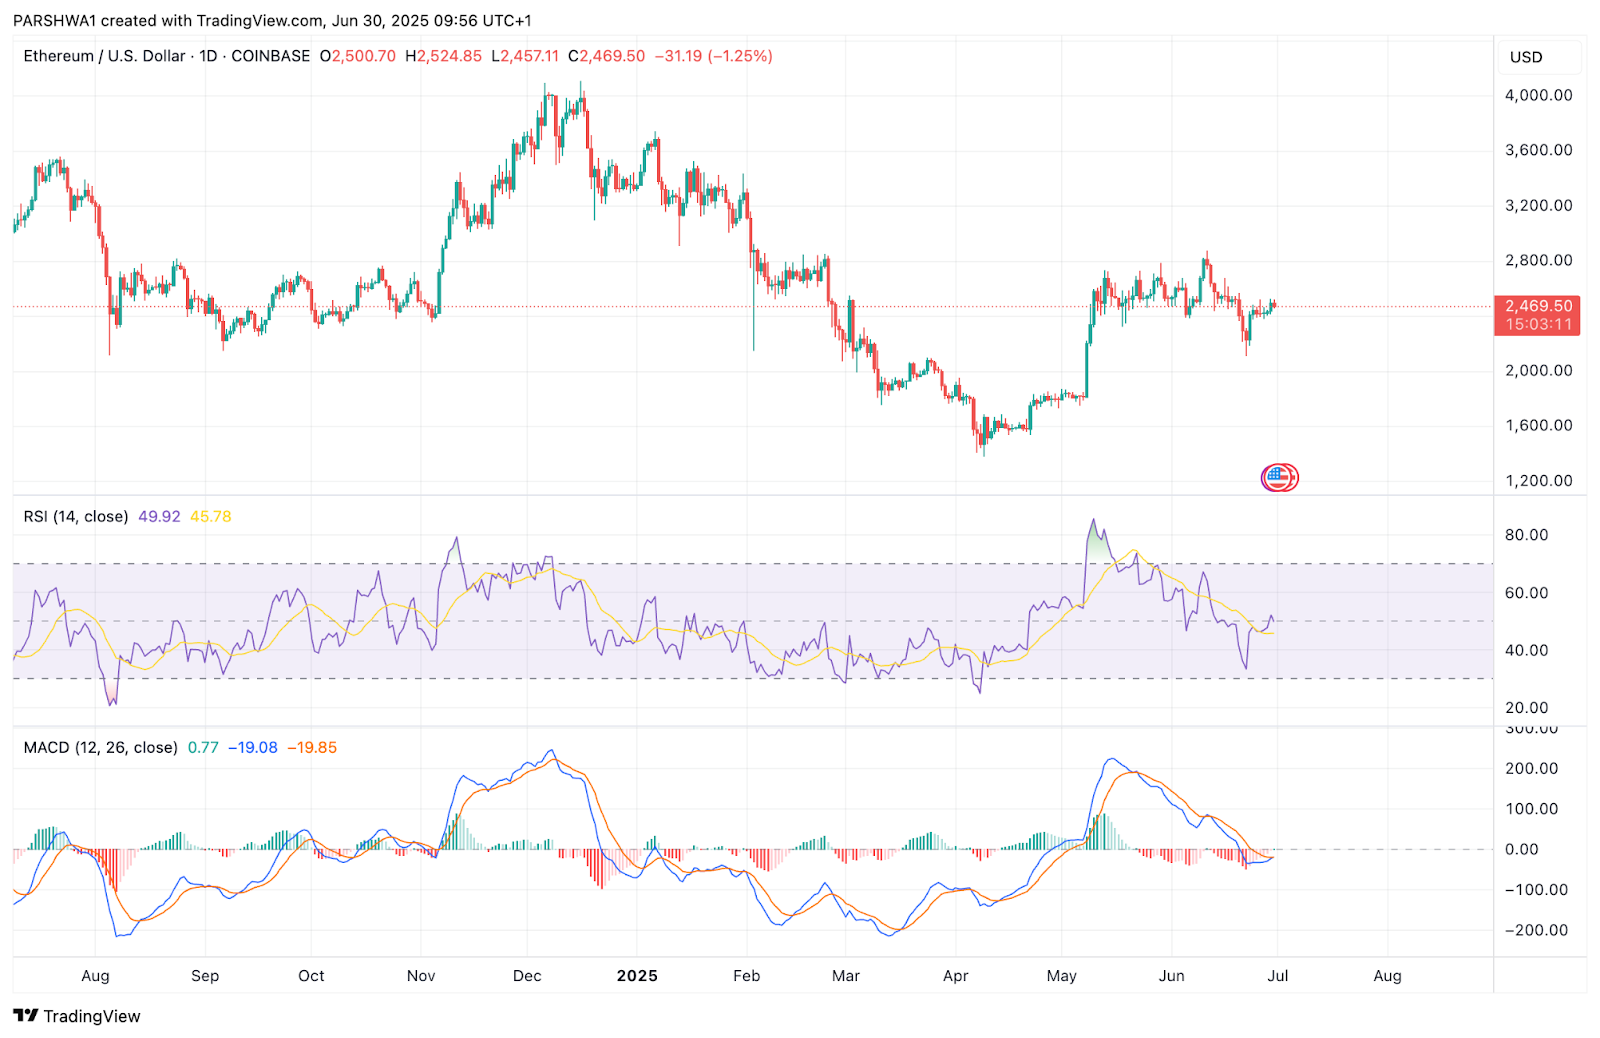
The RSI (14) is currently 49.92, signaling indecisiveness after hovering near the midpoint and recovering from the sold conditions. The momentum remains neutral, but is bullish as RSI rises from its low in late June.
MACD (12, 26) shows the early bullish divergence of the histograms print higher lows and the MACD line attempts to cross over the signal line. Although confirmation is pending, the setup suggests that momentum could shift towards the upward trend if pressure rises in early July.
ETH Price Dynamics (Source: TradingView)
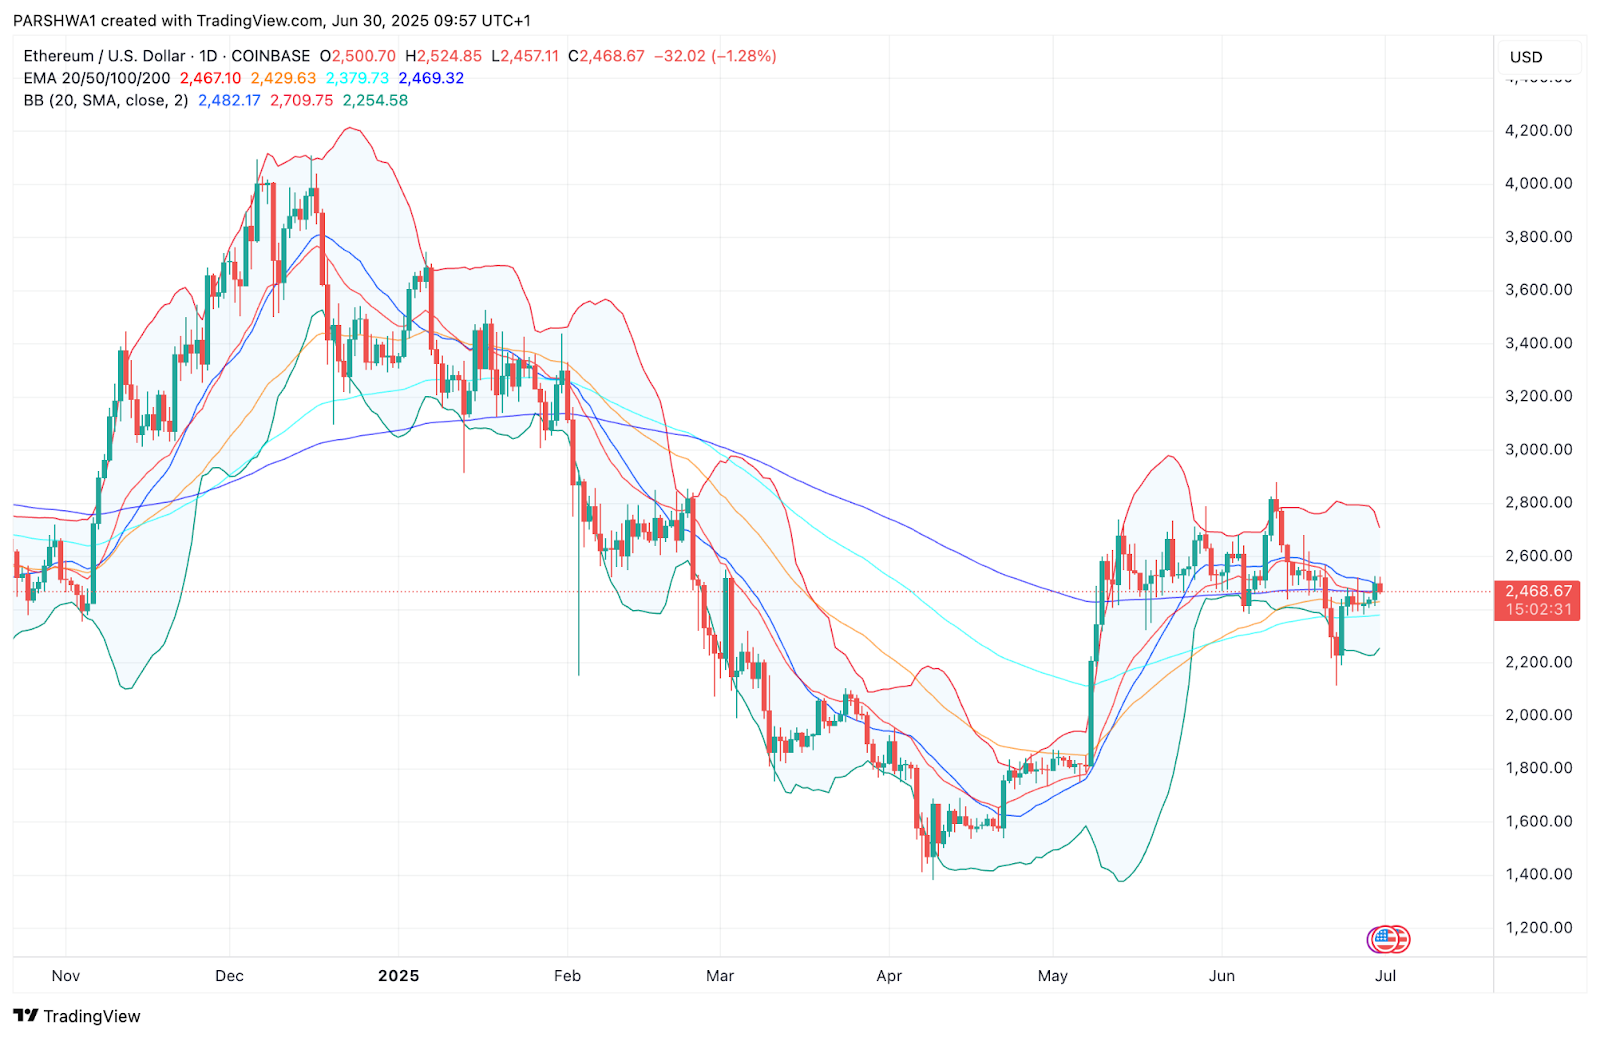
The bollinger band is narrower, indicating a low volatility environment. The price is just below the midband (~$2,470), with the upper band close to $2,709 and the lower band close to $2,254. Breakouts that exceed these limits can cause sharp movements.
The EMA levels are well clustered. ETH is currently trading above the 20-day EMA ($2,467) and just below the 50-EMA ($2,479). 100-EMA ($2,379) and 200-EMA ($2,469) serve as deeper trend support. Daily closures above the 50-EMA could bring new bullish momentum.
What to expect from this month's Ethereum prices
ETH Price Dynamics (Source: TradingView)
July 2025 could be a decisive month for Ethereum as prices within the downward triangle pattern wind the coils. A breakout that surpasses the $2,600 barrier could trigger new rally towards the $2,746 Fibonacci level, potentially nearly $3,000 in the 0.618 retracement zone if broader market conditions support bullish continuity.
However, if Ethereum cannot regain its supply zone of $2,500-$2,600 earlier in the month, the Bears will regain control and drag the price towards an ascending support trend line of nearly $2,250. The breakdown from there is that if sentiment gets worse, then even clusters between $2,026, 0.236 Fibonacci levels, and even $1,850-$1,600 can target major demand zones.
Overall, Ethereum is approaching an important decision point. The integration is approaching maturity, and volume analysis shows an increase in accumulation near the current range.
Will Ethereum prices reach $2,750 this month?
ETH Price Dynamics (Source: TradingView)
Ethereum has a realistic pass to $2,750 if it can maintain pressure above the $2,600 resistance line. This level not only marks the top of the downward structure, but is also close to the 0.5 FIB retracement. A clean break that surpasses that can drive momentum to $2,746 and even challenge the $3,000 psychological barrier.
However, in this scenario, Bitcoin may remain strong beyond $105,000-110,000, and the AltCoin flow may need to spin courtesy of Ethereum. On the contrary, a decline below $2,400 could negate bullish outlook and push ETH back towards the lower demand zones that were highlighted earlier.
Conclusion
The July 2025 Ethereum price forecast reflects the market at the edge of the breakout. The indicator is neutral, but supports increased volatility, but the price structure is compressed within a descending triangle just below the key supply zone. A confirmed move above $2,600 could trigger a run to more than $2,750, but if you don't hold $2,400 it could be deeply retested to $2,200 or $2,026. Traders should monitor critical price actions early in the month to determine whether the Bulls or Bears are in control.
Disclaimer: The information contained in this article is for information and educational purposes only. This article does not constitute any kind of financial advice or advice. Coin Edition is not liable for any losses that arise as a result of your use of the content, products or services mentioned. We encourage readers to take caution before taking any actions related to the company.