

Bitcoin has been trading around $107,000 since the recent flash crash and is holding steady to prevent further declines, but has yet to return to trading above $110,000. Notably, popular crypto analyst Titan of Crypto shared a detailed Gaussian channel analysis on X that shows Bitcoin's macro bullish structure remains intact. Despite short-term volatility. His post is accompanied by a Bitcoin price chart that shows how Bitcoin's position relative to the Gaussian channel clearly indicates the ongoing cycle.
The bull market on the Gaussian channel remains
crypto titan pointed out Bitcoin’s position above the Gaussian channel indicates the strength of the long-term trend. As shown in the weekly candlestick price chart below, green channels correspond to bullish phases and red areas represent bearish declines, a prime example of which is the 2022 bear market.
As of this writing, the upper band sits around $101,300 and is trending upward. Therefore, Bitcoin's price action around $107,000 means that it has not yet entered the Gaussian channel and the overall market structure is still solid. From this, we can deduce that Bitcoin's current pullback from its all-time high above $126,000 on October 6th is only a temporary pause. Within a larger bull market.
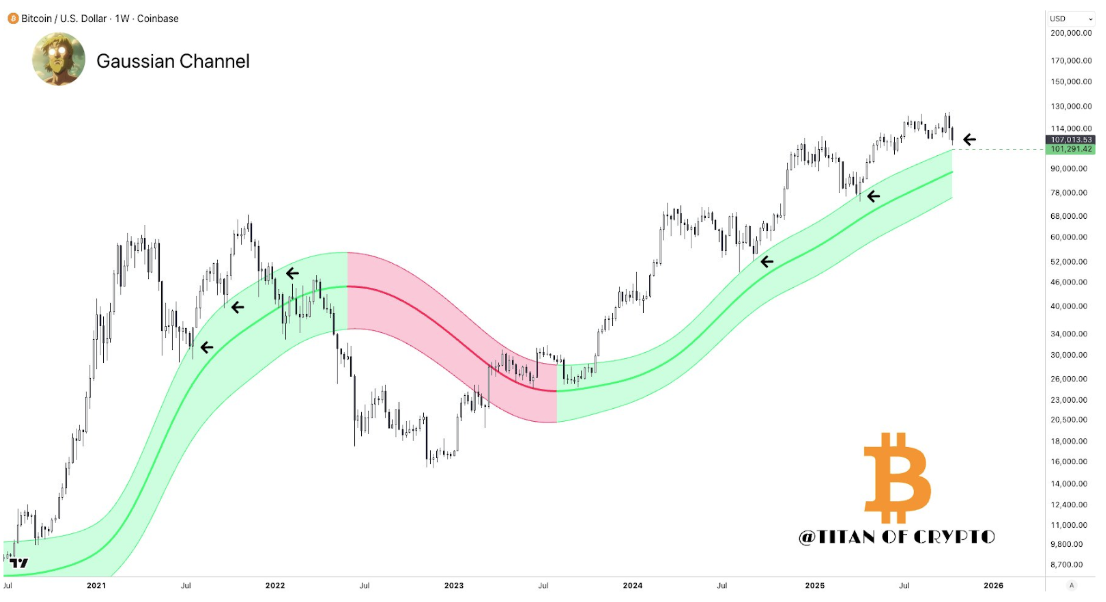
Bitcoin Gaussian Channel. Source: Titan of Crypt on X
However, although the Gaussian channel reading looks good, Titan of Crypto pointed out that this indicator should not be treated as a trigger for trading. “This is not a buy signal. It's an indicator of the macro situation.” he said. Just because it's above the Gaussian channel doesn't necessarily mean buying more. It simply means that the bull market structure is still intact.
Gaussian channel works best When combined with other indicators Trading volumes, moving averages, on-chain accumulation trends, etc. to confirm directional momentum.
Coinbase Premium Gap Turns Red
As for other indicators, CryptoQuant’s on-chain data shows that the Coinbase Premium Gap, an indicator that compares the price of Bitcoin on Coinbase and other exchanges, has turned red. As shown in the chart below, Coinbase's premium gap dropped sharply from a positive premium level of over +60 at the beginning of the week to -40 as Bitcoin price fell to $101,000.
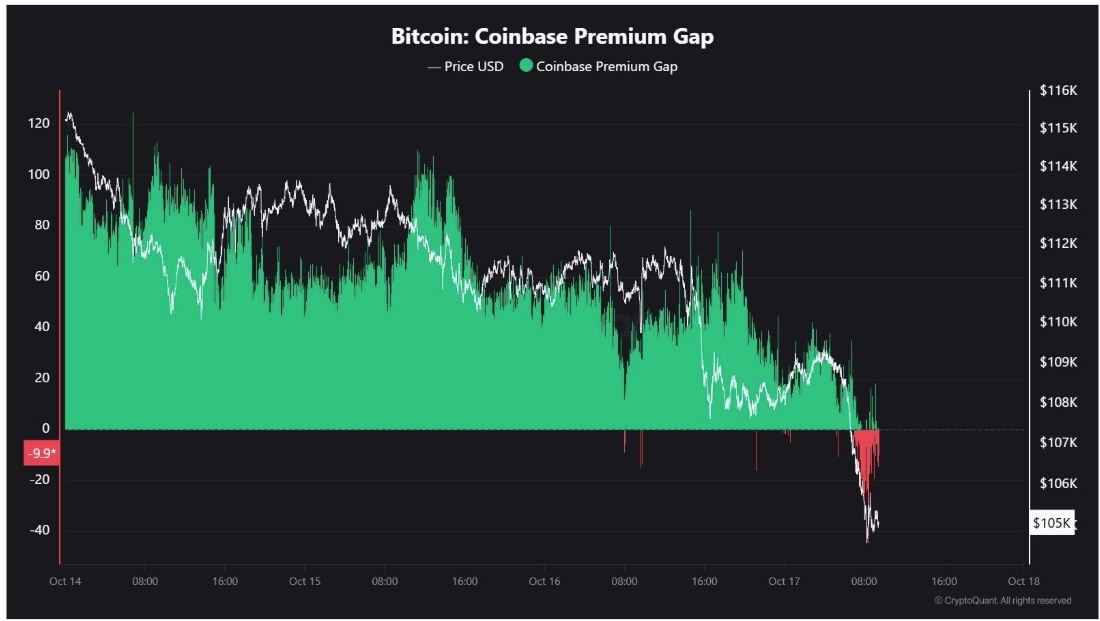
Bitcoin: Coinbase Premium Gap
Interestingly, as of this writing, Coinbase's premium gap has increased to around -10. This means that US investors Starting to get bullish again. This can be seen as a bullish signal as a similar drop in US demand was recorded from March to April before Bitcoin prices ultimately rose more than 60% to new all-time highs.
However, the red Coinbase premium gap alone is not decisive. That's how it should be be interpreted with other things Data points such as ETF inflows, trading volumes, liquidity, and derivative funding rates. At the time of this writing, Bitcoin was trading at $107,120.
Featured image from Vecteezy, chart from TradingView