

Ethereum is once again under pressure to find the strength to regain the $4,000 level amid growing uncertainty across cryptocurrency markets. Investor sentiment has become increasingly cautious amid mixed opinions among analysts. Some are warning that a bear market could be forming, while others believe this correction could be ahead of a major rally in the coming weeks.
According to CryptoQuant insights, the latest on-chain data shows notable changes in Ethereum exchange activity that could shape near-term price dynamics. Despite the recent ETH price decline, the 7-day moving average of Exchange Netflow (total) has shifted from massive outflows to inflows. It rose from around -57,000 ETH on October 16th to +7,000 ETH recently.
This change means more ETH is now moving to exchanges, which means selling pressure is likely to increase as traders prepare to offload their assets amid the volatility. Historically, such surges in inflows have often preceded short-term declines, especially when accompanied by negative market sentiment. However, some analysts warn that this may reflect whale relocation or liquidity management rather than full distribution.
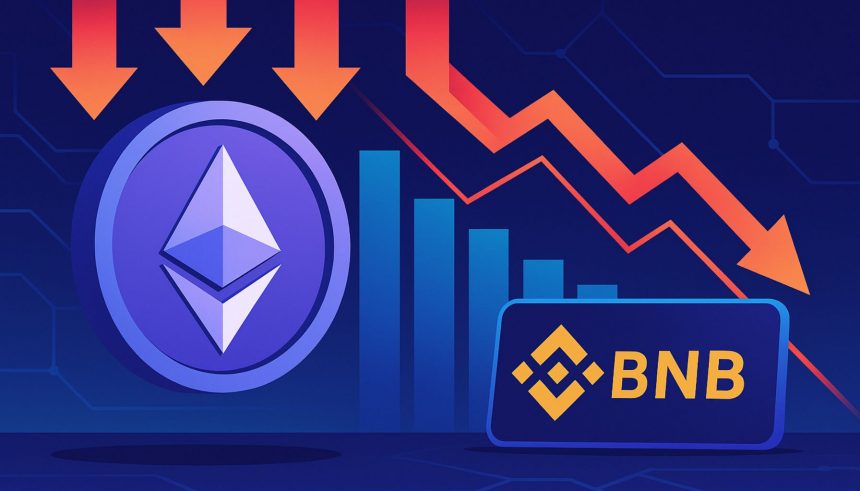
Ethereum exchange inflows surge due to Binance activity signal
According to CryptoOnchain's latest analysis on CryptoQuant, Binance appears to be playing a significant role in Ethereum's recent exchange flow dynamics. Data shows that Binance's 7-day net flow has changed dramatically from around -31,000 ETH on October 15th to +3,000 ETH in recent days. This single exchange accounts for nearly 50% of the total fluctuations observed across all major trading platforms, highlighting its significant influence on Ethereum’s short-term liquidity landscape.

A sudden and pronounced increase in ETH deposits on exchanges, especially during periods of bearish price, is generally considered a short-term signal of weakness. When a trader or institutional holder transfers coins from a personal wallet to an exchange, it often means they are ready to sell or redeploy in anticipation of further declines. As a result, increased intraday supply can add selling liquidity, making it easier for large sell orders to have a greater impact on price action.
But analysts caution against interpreting these moves too narrowly. Foreign exchange inflows often outpace selling pressure, but may also reflect strategic hedging, collateral deposits for derivatives trading, or liquidity management during periods of market stress.
Nonetheless, when combined with broader macro uncertainty and Ethereum's efforts to remain above key technical levels, this data reinforces the cautious sentiment prevalent across markets. If inflows continue and Ethereum fails to defend support near $3,800-$3,700, downside risks could intensify. Conversely, a rapid recovery in outflows would restore investor confidence and potentially set the stage for a stronger recovery.
Major support for ETH holdings amid uncertainty
As seen on the 3-day chart, Ethereum is currently trading around $3,880 and remains slightly above key short-term support levels near $3,700 to $3,750. The recent retracement has pushed ETH back to its 50-day moving average, which now serves as an important line of defense against the bulls.

After failing to stay above the $4,400 level earlier this month, Ethereum has entered a correction phase that reflects broader weakness in the altcoin market. The price structure is making lower highs after local highs, indicating that momentum is waning. However, the broader uptrend remains technically intact as long as ETH stays above its 100-day moving average near $3,400.
If the current support holds, Ethereum could attempt another recovery towards $4,000-$4,200, where high resistance and previous liquidity clusters are located. A confirmed close above this area signals renewed strength and potentially the end of this correction phase.
The downside is that a decisive break below $3,700 could lead to larger losses for ETH, targeting $3,400 and $3,000, where historical demand is stronger. Currently, Ethereum's price action remains at a pivotal point, balancing near-term weakness with the potential for recovery in the medium term.
Featured image from ChatGPT, chart from TradingView.com
editing process for focuses on providing thoroughly researched, accurate, and unbiased content. We adhere to strict sourcing standards, and each page is diligently reviewed by our team of leading technology experts and seasoned editors. This process ensures the integrity, relevance, and value of the content for readers.