


Ethereum price is on track to recover as the US spot exchange-traded fund recorded $141 million in inflows, showing renewed investor confidence after days of outflows.
summary
- Ethereum is trading near $3,857 after a three-day reversal of ETF outflows.
- The Spot ETH ETF saw $141 million in inflows led by Fidelity and BlackRock.
- The main support is seen at $3,800, with the next resistance seen around $4,500.
Ethereum is trading at $3,857, down 0.2% in the past 24 hours. Over the past 7 days, the token has fluctuated between $3,709 and $4,183, resulting in a 10% decline compared to the past 30 days and a 6% weekly loss. Ethereum remains 21% below its August high of $4,946.
Despite the recent pullback, Ethereum (ETH) market activity is increasing. According to Coinglass data, 24-hour trading volume rose 35.2% to $45.8 billion, while derivatives trading volume rose 57.3% to $114.2 billion.
Open interest also rose 0.6% to $43.8 billion, suggesting traders are starting to rebuild positions after last week's correction.
Spot ETH ETF resumes inflows
After three consecutive days of redemptions, the US Spot Ethereum ETF recorded net inflows of $141.6 million on October 21, according to SoSoValue data. Fidelity's FETH topped the list with $59.07 million, followed by BlackRock's ETHA with $42.46 million.
Grayscale’s Mini ETH and ETHE saw small but notable inflows of $22.58 million and $13.14 million, respectively. No ETFs reported outflows on this day.
You may also like: Ethereum’s Fusaka upgrade introduces transaction gas limit cap with EIP-7825
Analysts say this new inflow could lead to a boost in ETH prices in the short term, especially if the momentum continues into late October. Investors are also paying close attention to the upcoming FOMC interest rate decision (October 28-29), with the market pricing in a 25bps rate cut with a 95% probability.
A dovish signal could increase the liquidity of risky assets such as cryptocurrencies. However, the Fed's hawkish stance could reignite macro pressures.
Ethereum price technical analysis
The daily chart shows Ethereum trading below the Bollinger Band midline at $4,146, with resistance at $4,720 and support near $3,563. Price compression is signaled by band narrowing, which often appears before a large directional move.
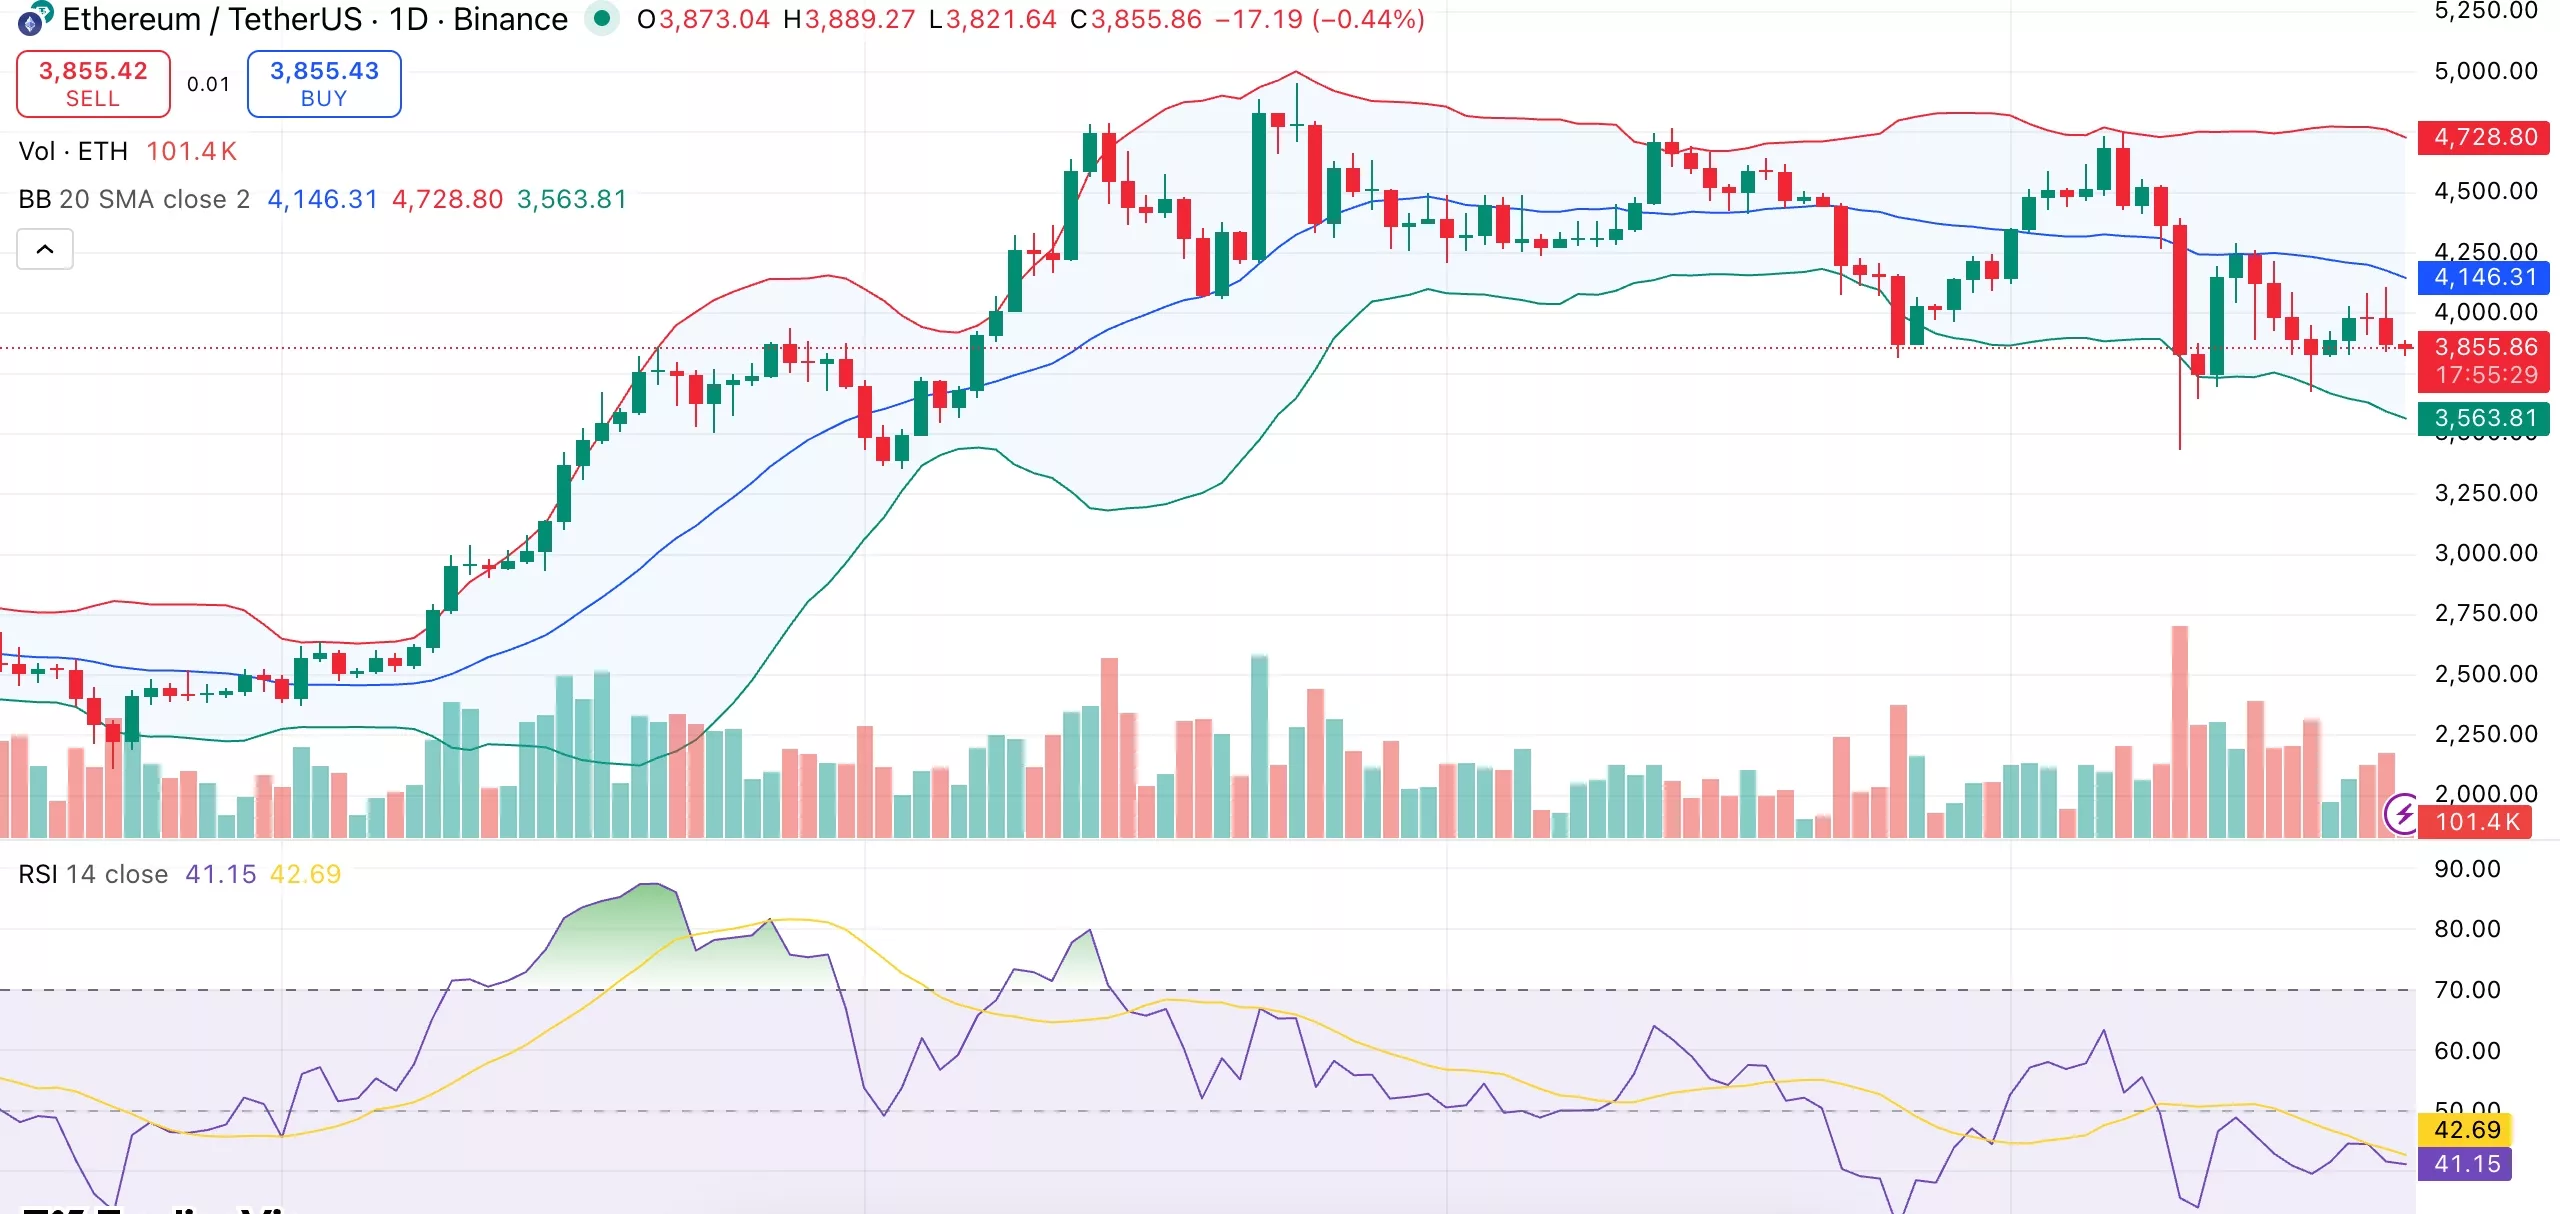
Ethereum daily chart | Source: crypto.news
The Relative Strength Index is 41.15, indicating that the market is not yet in oversold territory but is showing bearish momentum. A short-term recovery could be confirmed by a rebound above 45-50 RSI, while a break below 40 could trigger another decline.
Most of the moving averages, such as the 10-day, 20-day, 50-day, and 100-day EMA, are showing sell signals, indicating that the trend remains weak in the short term. However, the 200-day EMA is lower at $3,570, still suggesting a long-term uptrend.
If ETF inflows continue and the Fed confirms a rate cut, ETH could gain momentum above $3,900 and retest the $4,350-$4,500 range. If inflows slow or macro sentiment worsens, Ethereum could fall below $3,800, paving the way for support at $3,560 and even $3,400.
read more: Ethereum price chart suggests resurgence due to falling foreign exchange reserves