


Ethereum (ETH) is showing renewed volatility as traders focus on developments in both price compression and tensions within the community. After failing to maintain momentum above the Fibonacci resistance at $4,254, ETH has entered a correction phase and is consolidating below the key exponential moving average (EMA). The 20-EMA at $3,947, 50-EMA at $3,987, and 100-EMA at $4,075 currently form key resistance zones that limit any upside recovery. The overall trend remains cautious as market sentiment shifts amid increased derivatives trading and developer dissonance.
Pricing consolidation and key support levels
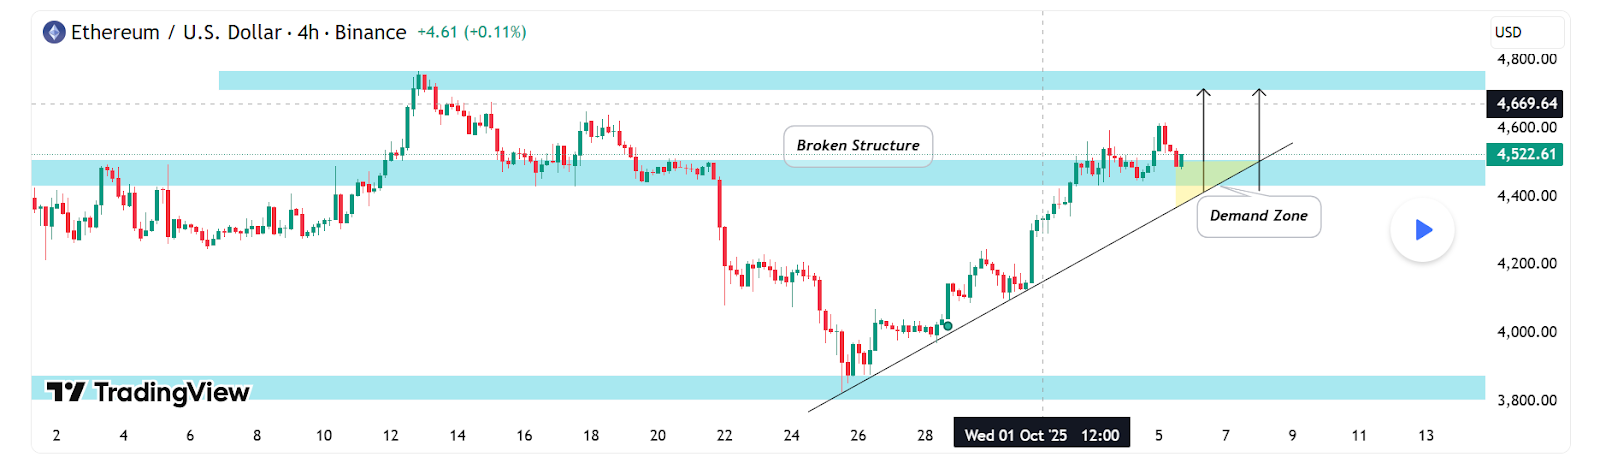
ETH price dynamics (Source: TradingView)
The 4-hour chart shows that Ethereum’s price structure is tightening between the 0.382 Fibonacci level at $3,943 and the 0.236 retracement around $3,750. This compression reflects a short-term accumulation zone where traders wait for directional confirmation. If the price closes below $3,850, ETH could be exposed to even bigger losses towards $3,750 and even the recent local low of $3,439.
However, if buyers defend the $3,850 to $3,900 area, the first resistance challenge lies at $4,075, matching the 100-EMA. A decisive break above the 200-EMA at $4,166 would signal a reversal and open the way to $4,254 and $4,476.
Related: Bitcoin Price Prediction: BlackRock Selling Challenges Bullish Sentiment
Therefore, ETH’s next move will depend on whether it can sustain above $3,850. The zone between $3,400 and $3,450 remains a safety net if selling pressure intensifies. The higher timeframe support at $3,750 will continue to attract buyers hoping for a rebound, especially if Bitcoin stabilizes above $108,000.
Futures market shows strong participation
Importantly, Ethereum futures open interest more than doubled in 2025, reaching over $44 billion by mid-October. This growth indicates active participation of traders and capital inflows.
The correlation between open interest and spot prices suggests increased speculative demand ahead of large price movements. Sustained growth in both indicators reflects renewed confidence among institutional investors and could trigger a period of increased volatility as traders position for a breakout.
On-chain outflow signal accumulation
Furthermore, October was dominated by spot Ethereum outflows, with nearly $97.6 million leaving the exchange on October 21st. These consistent outflows suggest that investors are moving assets into self-custody or staking, suggesting that supply on exchanges is decreasing. Historically, such a pattern precedes a medium-term recovery once sales stabilize.
Developer Rift raises community tensions
Amid these market changes, Ethereum's leadership faces internal tensions. Core developer Péter Szilágyi recently accused founder Vitalik Buterin and his inner circle of having too much control over the network's decisions.
Related: Cardano Price Prediction: ADA faces range pressure as momentum cools
In response, Buterin acknowledged the challenges while praising Polygon's role in driving Ethereum's scalability. Analysts believe the ongoing discussions highlight the growing pressure within the Ethereum ecosystem, which is targeting a 10x scalability milestone within a year.
We really appreciate both @sandeepnailwal's personal contribution and @0xPolygon's invaluable role in the Ethereum ecosystem.
In summary:
* Polygon hosts @Polymarket. This is perhaps the most successful example of a “not just boring finance” app that actually delivered results.
— vitalik.eth (@VitalikButerin) October 21, 2025
Technical outlook for Ethereum (ETH) price
As Ethereum enters its next consolidation phase, the key levels remain clearly defined. Upside levels: $4,075, $4,254, and $4,476 serve as immediate resistance zones. If a breakout above $4,254 is confirmed, the rally could extend towards $4,600 and $4,850.
Downside Levels: Near-term pivot support at $3,850, followed by recent local lows at $3,750 and $3,439. The 200-EMA at $4,166 stands as the medium-term upper bound that the bulls need to regain to decisively shift momentum upwards.
Technical imagery shows Ethereum compressing between the 0.382 and 0.236 Fibonacci zones ($3,943-$3,750), suggesting an area of accumulation before the next trend extension. A decisive move above $4,075 (100-EMA) could signal bullish control once again, but a break below $3,750 risks paving the way to $3,400-$3,450.
Will Ethereum rebound?
Ethereum’s near-term trajectory will depend on how it reacts around the $3,850 to $3,900 support range. Continued defense at this level could spark fresh momentum above $4,254.
Related: Chainlink Price Prediction: Are Fed Valuations and Oracle Strength Enough to Stop the Drop?
However, a failed hold could expose ETH to a more severe correction before the next recovery leg. Increased open interest and consistent currency outflows make more volatility look imminent, suggesting that Ethereum could break out of a tightening range soon.
Disclaimer: The information contained in this article is for informational and educational purposes only. This article does not constitute financial advice or advice of any kind. Coin Edition is not responsible for any losses incurred as a result of the use of the content, products, or services mentioned. We encourage our readers to conduct due diligence before taking any action related to our company.