

Ethereum is hovering in the middle of the Bollinger Bands as support holds, and new liquidations suggest a fragile rebound.
Ethereum has spent the past 24 hours testing market nerves near $2,800. After stabilizing near the top of the range for most of the day, the price fell sharply during the day from just below $2,845 to a low near $2,725, erasing earlier gains. This flash was followed by a steady rally, with ETH rallying towards $2,800, but it is still down about 0.8% on the day at about $2,809.
Looking at it through a longer lens, Ethereum's chart shows a slow and harsh rebound rather than a sudden collapse. Over the past seven days, ETH has fallen by approximately 4.3%. If we expand the horizon to 14 days, the situation looks similar, with each attempt to break above $2,900 creating new supply and widening the loss to around 6.6%.
Despite the decline, Ethereum's market cap is still over $338 billion, supported by nearly $30 billion in 24-hour trading volume. On the other hand, the pattern on the chart is a sudden drop, consolidation at the low and a partial recovery, setting the stage for a decisive phase. next move.
What’s next for Ethereum?
Specifically, on the daily chart, Ethereum is still locked in a clear downtrend, trading below the 20-day Bollinger Band simple moving average (approximately $2,976), and has spent much of the last month in the lower half of the volatility envelope. The latest attempt to push higher has stalled almost exactly at this mid-band, with the current candle bouncing towards the lower band around $2,705.
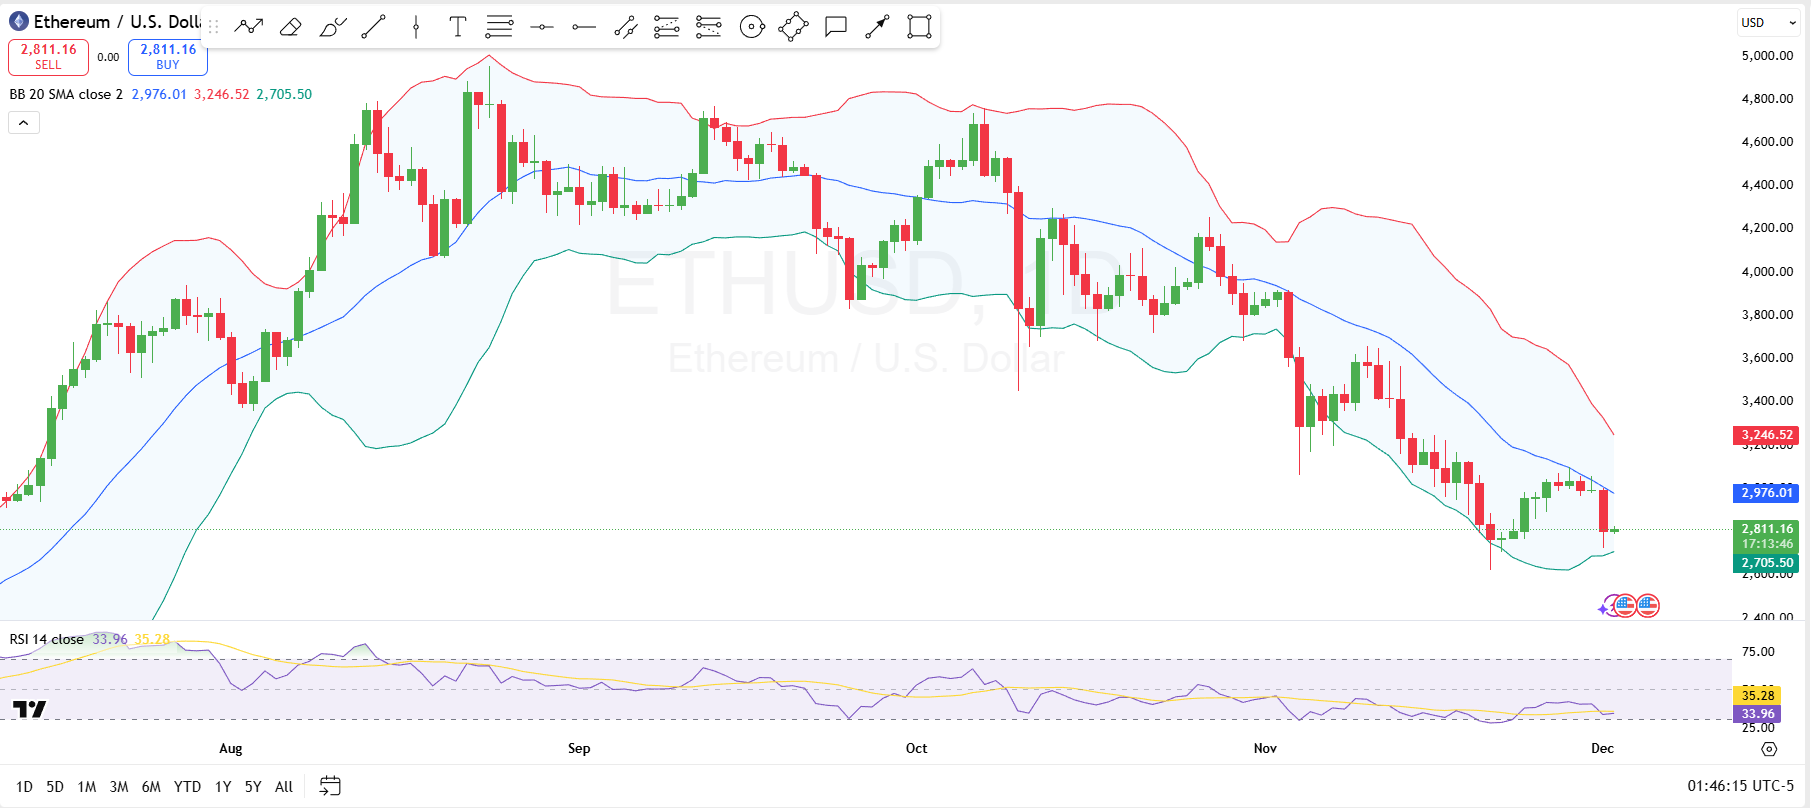
Ethereum daily chart
This puts the immediate resistance in the $2,950-$3,000 zone, followed by the upper Bollinger Bands and the recent swing area around $3,200-$3,250. As long as the price remains below the 20-day SMA, the bears maintain the technical advantage.
The lower end of the Bollinger Band near $2,700 is currently acting as short-term support, with the furthest wick located near $2,623, and the psychological $2,500 zone serving as a deeper downside level to monitor if the sell-off resumes.
Meanwhile, the 14-day RSI is around 34, well below the neutral line of 50, but still slightly above the classic oversold region of 30.
This number confirms that bearish momentum is dominant and also suggests that the market is approaching the zone where the previous decline began to end. To reveal a more constructive picture, traders would like to see the RSI rise above 40 and, importantly, close above the 20-day SMA on a daily basis, which would open the door to a retest of the $3,000 and $3,200 resistance bands.
Ethereum clearing data
further liquidation data This shows how hard the leverage reset around Ethereum's latest move. Over the past 24 hours, approximately $105.18 million in positions were extinguished, with approximately $78.97 million longs liquidated and $26.21 million short. This bias toward long-term liquidations confirms that the initial phase of the move was driven by aggressive selling, forcing overleveraged bullish traders out of the market.
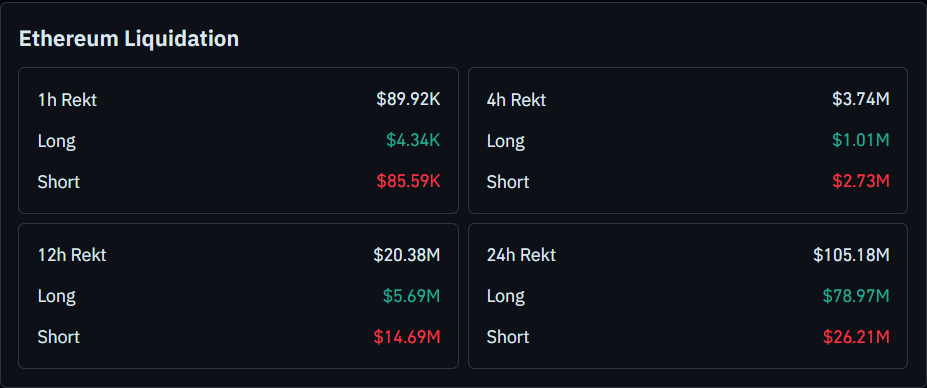
Ethereum liquidation
However, the situation during the day is starting to reverse. Total liquidations in the past 12 hours were approximately $20.38 million, with shorts ($14.69 million) significantly higher than longs ($5.69 million). The latest 1-hour window also shows the same pattern. The liquidation amount is approximately $89.92,000, of which $85.59,000 is short. Looking at the 4-hour time frame, short positions of $2.73 million outweigh long positions of $1.01 million.
This change suggests that after the initial long flash, the subsequent rally toward $2,800 has begun to weigh on late bearish positions, suggesting a short-term attempt to stabilize prices above key support while a broader downtrend and 24-hour heavy liquidation still dampen upside momentum.