
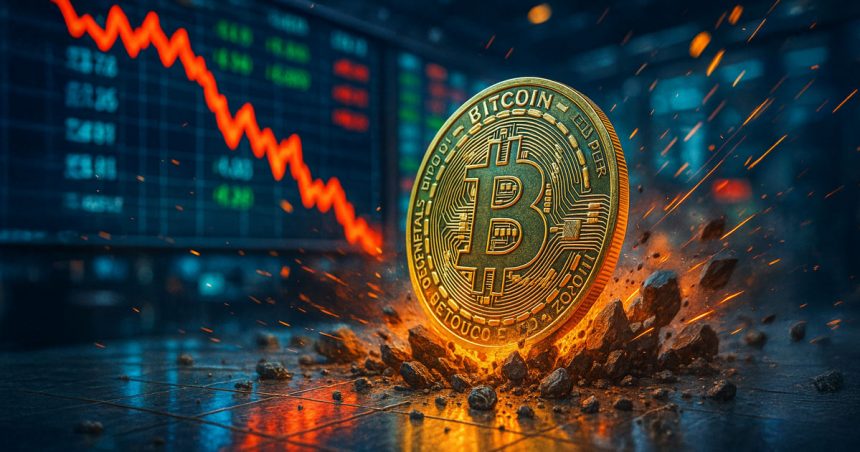
Bitcoin is trading near $86,000 as losses mount across ETFs, treasury companies and miners.
According to Checkonchain's Dec. 15 “system stress” note, investors are saddled with approximately $100 billion in unrealized losses.

Miners are driving down the hash rate, many of their stocks are trading below Bitcoin book value, and about 60% of the Spot Bitcoin ETF's inflows are underwater.
In Checkonchain's ETF Average Inflow Cost Basis and ETF Market Value vs. Realized Value (MVRV) chart, the ETF cost basis and true market average sit in the same area, approximately $80,000 to $82,000.
This brings the majority of the institution's positioning closer to break-even.
These anchors are important because they tie price movements to the balance sheet rather than chart patterns.
If prices remain below their total cost basis, realized losses may increase and liquidity may become thinner as participants exit and bounce positions.
Once the cohorts that became the primary demand sources in 2024 and 2025 share that zone, the market will have to decide whether institutional positioning acts as a lower bound on the cost base.
If that level breaks, it may cause a decline.
Glassnode also sets up a similar map
In its 49th Week On-Chain report, Glassnode wrote that Bitcoin is range-bound between the short-term cost of holding standard around $102,700 and the true market average around $81,300.
It established an initial recovery level of $95,000 (0.75 cost-based quantile).
Bitwise also points to the true market average value around $82,000 as a support base.
It describes support channels from approximately $82,000 to $75,000, tying that range to IBIT's cost base of nearly $81,000 and Strategy's cost base of nearly $75,000.

Bitwise estimates its unrealized losses after a drawdown of approximately 35% to be approximately $152 billion (approximately 6.6% of market capitalization), for a total loss of approximately $765 billion.
The stress characteristic is that the ETF's capitalization is between $75,000 and $85,000.
The total cost basis of the Spot Bitcoin ETF is approximately $80,000 with a capitalization of approximately $127 billion.
However, only 2.9% of that capital falls in the $75,000 to $85,000 range, giving it a thinner cushion as prices fall below the central cluster.
Amberdata also described a denser “fortress” zone between $65,000 and $70,000 that holds 15.2% of the ETF's capital.
If the market trades between $75,000 and $85,000, this distribution can lead to faster downside movements.
Even if prices rebound, realized losses are already rising
Glassnode posted entity-adjusted realized losses (30-day simple moving average) of nearly $555 million per day, the highest level since the FTX era of unwinding.
The company said a similar phenomenon has occurred even as prices have rebounded from their lows in late November to the low $90,000 range.
The report shows that after almost two years, the relative unrealized loss (30-day SMA) ranged from less than 2% to approximately 4.4%.
This is consistent with Checkonchain's view that the cycle has entered a stress regime.
ETFs will continue to play a central role as they serve as both structural allocation rails and short-term liquidity valves.
According to Bitbo's ETF tracker, U.S. Spot Bitcoin ETFs held a total of approximately 1,311,862 BTC (approximately $117.3 billion) as of December 15th.
BlackRock’s IBIT held approximately 778,052 BTC (approximately $69.6 billion) after recording mixed flows over the past two weeks, ultimately reaching net inflows of just $100 million.
This is a reminder that ETF demand can quickly reverse during risk-off periods.
The economic situation in the mining industry will be a further pressure factor, as weaker revenues may lead to inventory sales and investment deferrals.
Luxor Hashrate Index reported in its November review that the USD hash price averaged around $39.82, down 17.9% from the previous month.
It hit an all-time low of around $35.06 on November 22nd.

Luxor said its forward curve from December 2025 to April 2026 is approximately 16-18% down in US dollar terms.
Checkonchain also writes that miners are withdrawing hashrate.
Therefore, attention remains focused on whether the sector is approaching a capitulation-type flash or a more prolonged margin compression phase.
The third cohort, Bitcoin and government bonds, face funding constraints at the same time.
Reuters reported that Bitcoin treasury companies have purchased about $50 billion of Bitcoin over the past year, much of which is now trading at a discount to its net asset value.
This reduces the benefit of issuing shares to buy more Bitcoin.
If these stocks fall below the value of their underlying holdings, it becomes difficult to execute the “issue stocks and buy BTC” flywheel at scale.
Macro linkage has become an amplifier
Reuters cited data from LSEG showing that the average correlation between Bitcoin and the S&P 500 was nearly 0.5 in 2025, compared to about 0.29 in 2024.
He also mentioned that the correlation with the Nasdaq 100 is around 0.52 compared to about 0.23, and says that much of the drawdown is related to the stock risk regime, not just the virtual currency factor.

Interest rates are important in this setting because they determine risk appetite trends. Bank of America expects two more rate cuts in June and July 2026.
As such, the 2026 interest rate path remains close to the center of the debate around risk assets.
Taken together, this cumulative effect is why Checkonchain calls the current setup the most negative post-2022.
Underwater capital is concentrated in groups with price-sensitive balance sheets. Reflexive buyers have less flexibility in financing. Miners' margins will be compressed until early 2026. And the link between Bitcoin and risk assets is stronger than last year.
For readers looking to convert it into a forward-looking framework without turning it into trading advice, stress can be tracked through measurable gauges.
| Level (estimate) | what it represents |
|---|---|
| $81,000-$82,000 | True market average and ETF inflow cost based clusters |
| $95,000 | 0.75 cost-based quantile (recovery marker) |
| 102.7 thousand dollars | short-term holder cost basis |
| $75,000 | Lower limit of supported channels per bit (see MSTR cost criteria) |
| $65,000-$70,000 | Strengthening ETF capital concentration |
On-chain, the first step is to determine whether the realized loss criterion will roll over from its current level when the price no longer records new lows close to the true market average.
In flows, the question is whether large outflow days will continue to occur frequently or be replaced by more stable net behavior.
In mining, the focus will be on whether hash prices and forward curves will remain stable until early 2026, or whether margin stress will become more severe and businesses will be forced to downsize further.
The next balance sheet test leaves the cost basis in the $80,000 to $82,000 range.