

Renowned commodity trader Peter Brandt predicted that Bitcoin could crash to $25,240 now that the parabola has broken.
The cryptocurrency is currently struggling to gain a foothold above the $90,000 level.
exponential decay
Brandt's main argument is that Bitcoin's explosive growth has slowed over time. It's not dead, it's maturing. This essentially means that each “bull cycle” is no more powerful than the last one.
Bitcoin may have increased 100 times in 2011. In 2013, it was about 50 times more. 20 times more in 2017. In 2021, it will increase tenfold. What this means is that investors who expected the same incredible 100x returns in the early days were wrong (sorry, Michael Saylor). The “driving force” or energy of the market is decaying exponentially.
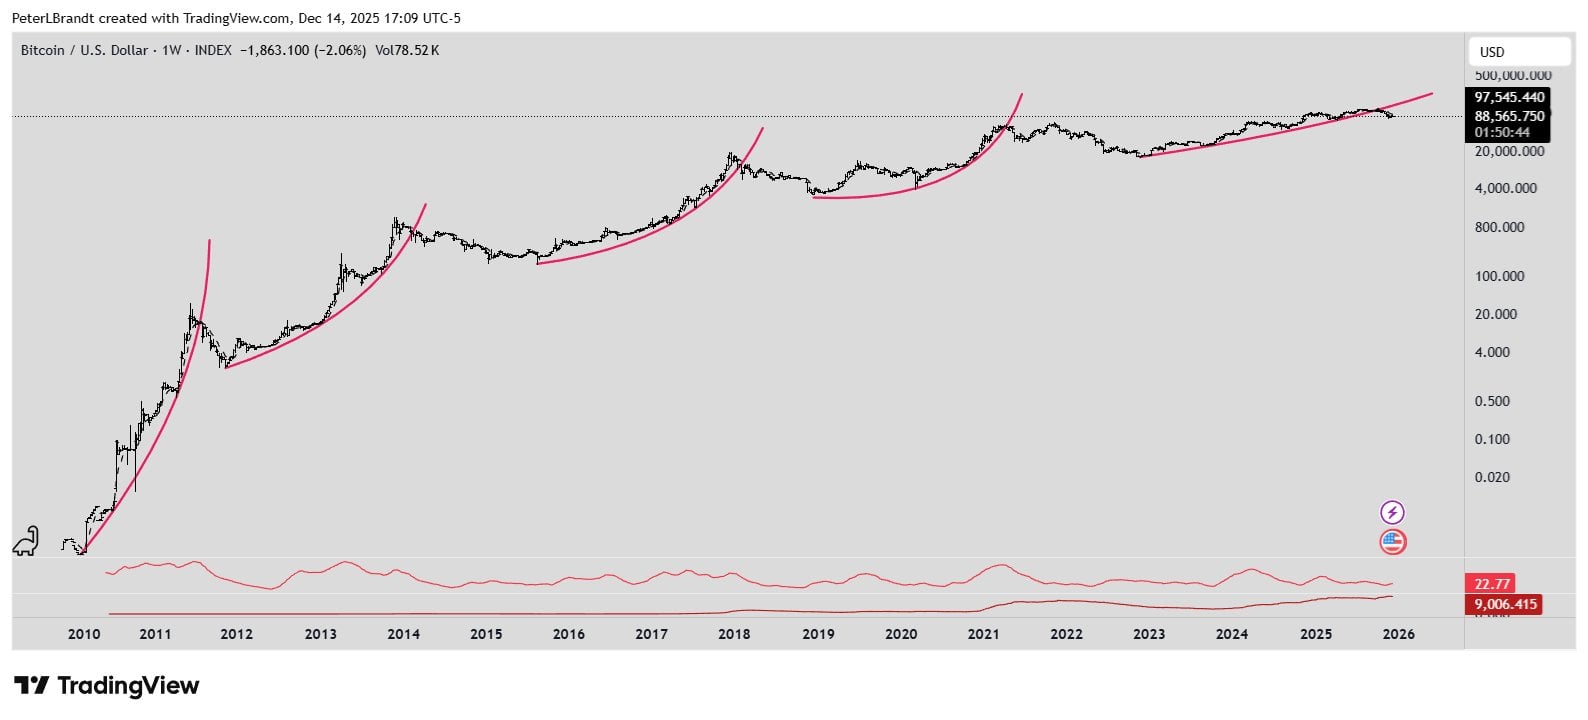
This chart shows the price of Bitcoin over the entire history of Bitcoin (2010-2025) on a logarithmic scale.
The four pink curves represent Bitcoin's parabolic progression. A parabola is a curve that becomes steeper over time. Brandt identifies four distinct cycles in which prices rose vertically.
At the end of the fourth pink curve, the price fell below the pink line. If the asset price falls below the parabolic support line, the trend is considered to be “broken” or broken. Every time Bitcoin broke a parabola in its history (2011, 2013, 2017), it crashed by more than 80%. For example, in 2018, BTC fell from $20,000 to $3,200.
Bitcoin has lost 80% of its value, leaving only $25,240, 20% of its all-time high (ATH).