

Ethereum prices have fallen nearly 18% over the past week as US Ether ETFs recorded six consecutive days of outflows, weighing on investor sentiment. A bearish reversal pattern on the daily chart warns of the risk of further losses in the future.
summary
- ETH price has fallen by nearly 18% over the past week.
- The US Ether ETF recorded $630 million in outflows for six consecutive days.
- Several bearish patterns are forming on the daily chart.
Ethereum (ETH) price fell to an intraday low of $2,781 on Friday, Dec. 19, down 18% from last week's high of $3,390 and 39% below its yearly high, according to data from crypto.news.
Ethereum prices have fallen as demand for spot ETFs wanes among institutional investors. The US Spot Ether ETF experienced net outflows for the sixth day in a row, with a total of $630 million outflows by the fund, according to SoSoValue data. Continued outflows from these institutional products tend to dampen investor appetite, often leading to further selling pressure on assets.
Broader macroeconomic factors are also driving investors away from crypto assets, including Ethereum, such as the Federal Reserve's recent hawkish tone on tapering rate cuts in early 2026 and the Bank of Japan's decision to raise interest rates from 0.25% to 0.75%, a 30-year high.
The price of ETH is also facing pressure from liquidations of highly leveraged traders in the derivatives market. According to CoinGlass data, around $158 million worth of positions were liquidated in the past 24 hours, adding further downward pressure on the price.
You may also like: Tether CEO warns of AI bubble as biggest market risk, Bitcoin looks to 2026
Ethereum price has been in an upward-expanding wedge pattern for over four weeks, featuring rising highs and rising lows, and the bears are once again starting to increase pressure. A break from such a pattern is usually seen as a signal of a bearish trend reversal in the coming days.
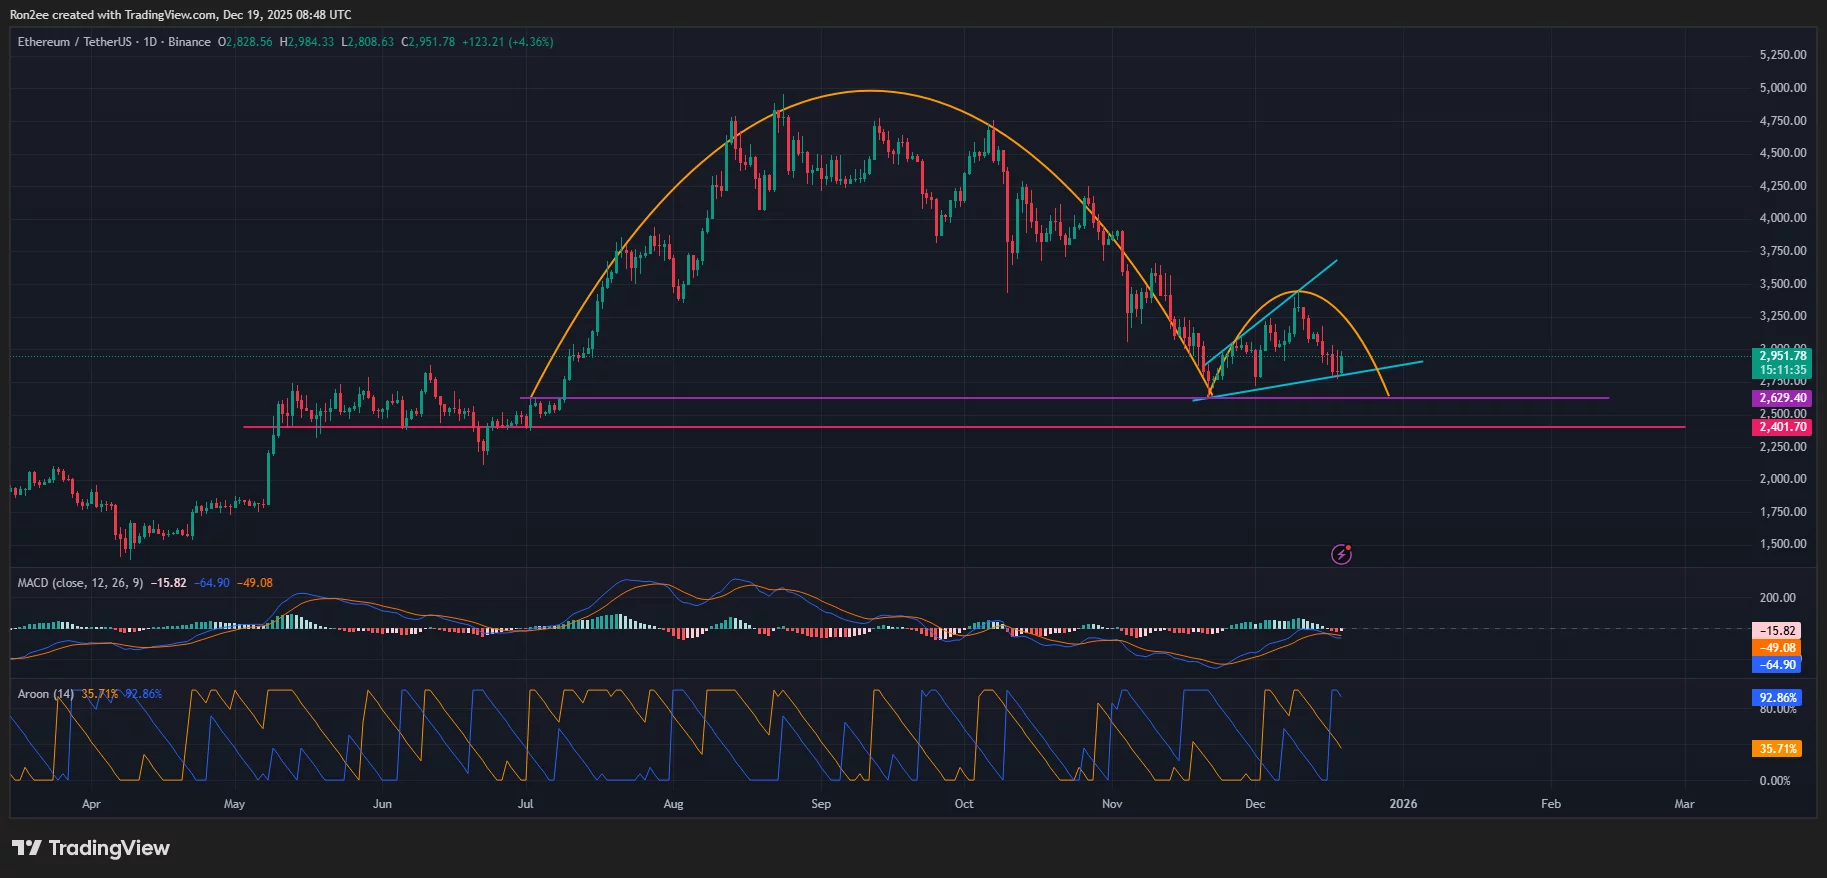
ETH price forms multiple bearish patterns on daily chart — December 19 | Source: crypto.news
At the time of writing, ETH was nearing a breakdown below the lower trendline of the pattern. If this trendline breaks, the price could fall below the neckline of the inverted cup-and-handle pattern at $2,629. This is a larger bearish structure that has been forming for several months and suggests that the downtrend could continue.
Technical indicators are also flashing bearish signs. For example, the MACD line is trending downward, indicating that the downtrend has not lost its momentum yet. On the other hand, the technical data confirms that the downward momentum continues to dictate the market direction, with the Aroon downtrend surging to 92.86% and the Aroon uptrend stagnant at 35.71%.
For now, $2,629 is an important level to watch. If this cannot be sustained, ETH price could next fall to $2,400. The above level has served as a strong floor for ETH throughout this year, and losing this level could open the door to further decline.
read more: BCH price chart sees huge double dip reversal, could whale buying trigger a breakout?
Disclosure: This article does not represent investment advice. The content and materials published on this page are for educational purposes only.