

Bitcoin's price on Wednesday was $87,234, with a market capitalization of $1.74 trillion, 24-hour trading volume of $36.9 billion, and an intraday trading range of $86,713 to $88,091, reflecting a cautious trend heading into Christmas Eve. This number suggests that Bitcoin is picking up pace, rather than rushing, as traders digest mixed signals across timeframes and indicators.
Bitcoin chart outlook
On the daily chart, Bitcoin is stuck in a sideways-to-downward position after failing to maintain its early December gains towards the mid-$94,000 region. Price action continues to carve highs and lows, forming a mild downward channel that indicates short-term fatigue rather than outright panic.
Volume has tapered off significantly, supporting the idea that momentum is fading on both sides of the market. Importantly, the price has not convincingly broken out of the $85,000-$86,000 support zone, indicating that broader consolidation is firmly in play rather than deeper unraveling.
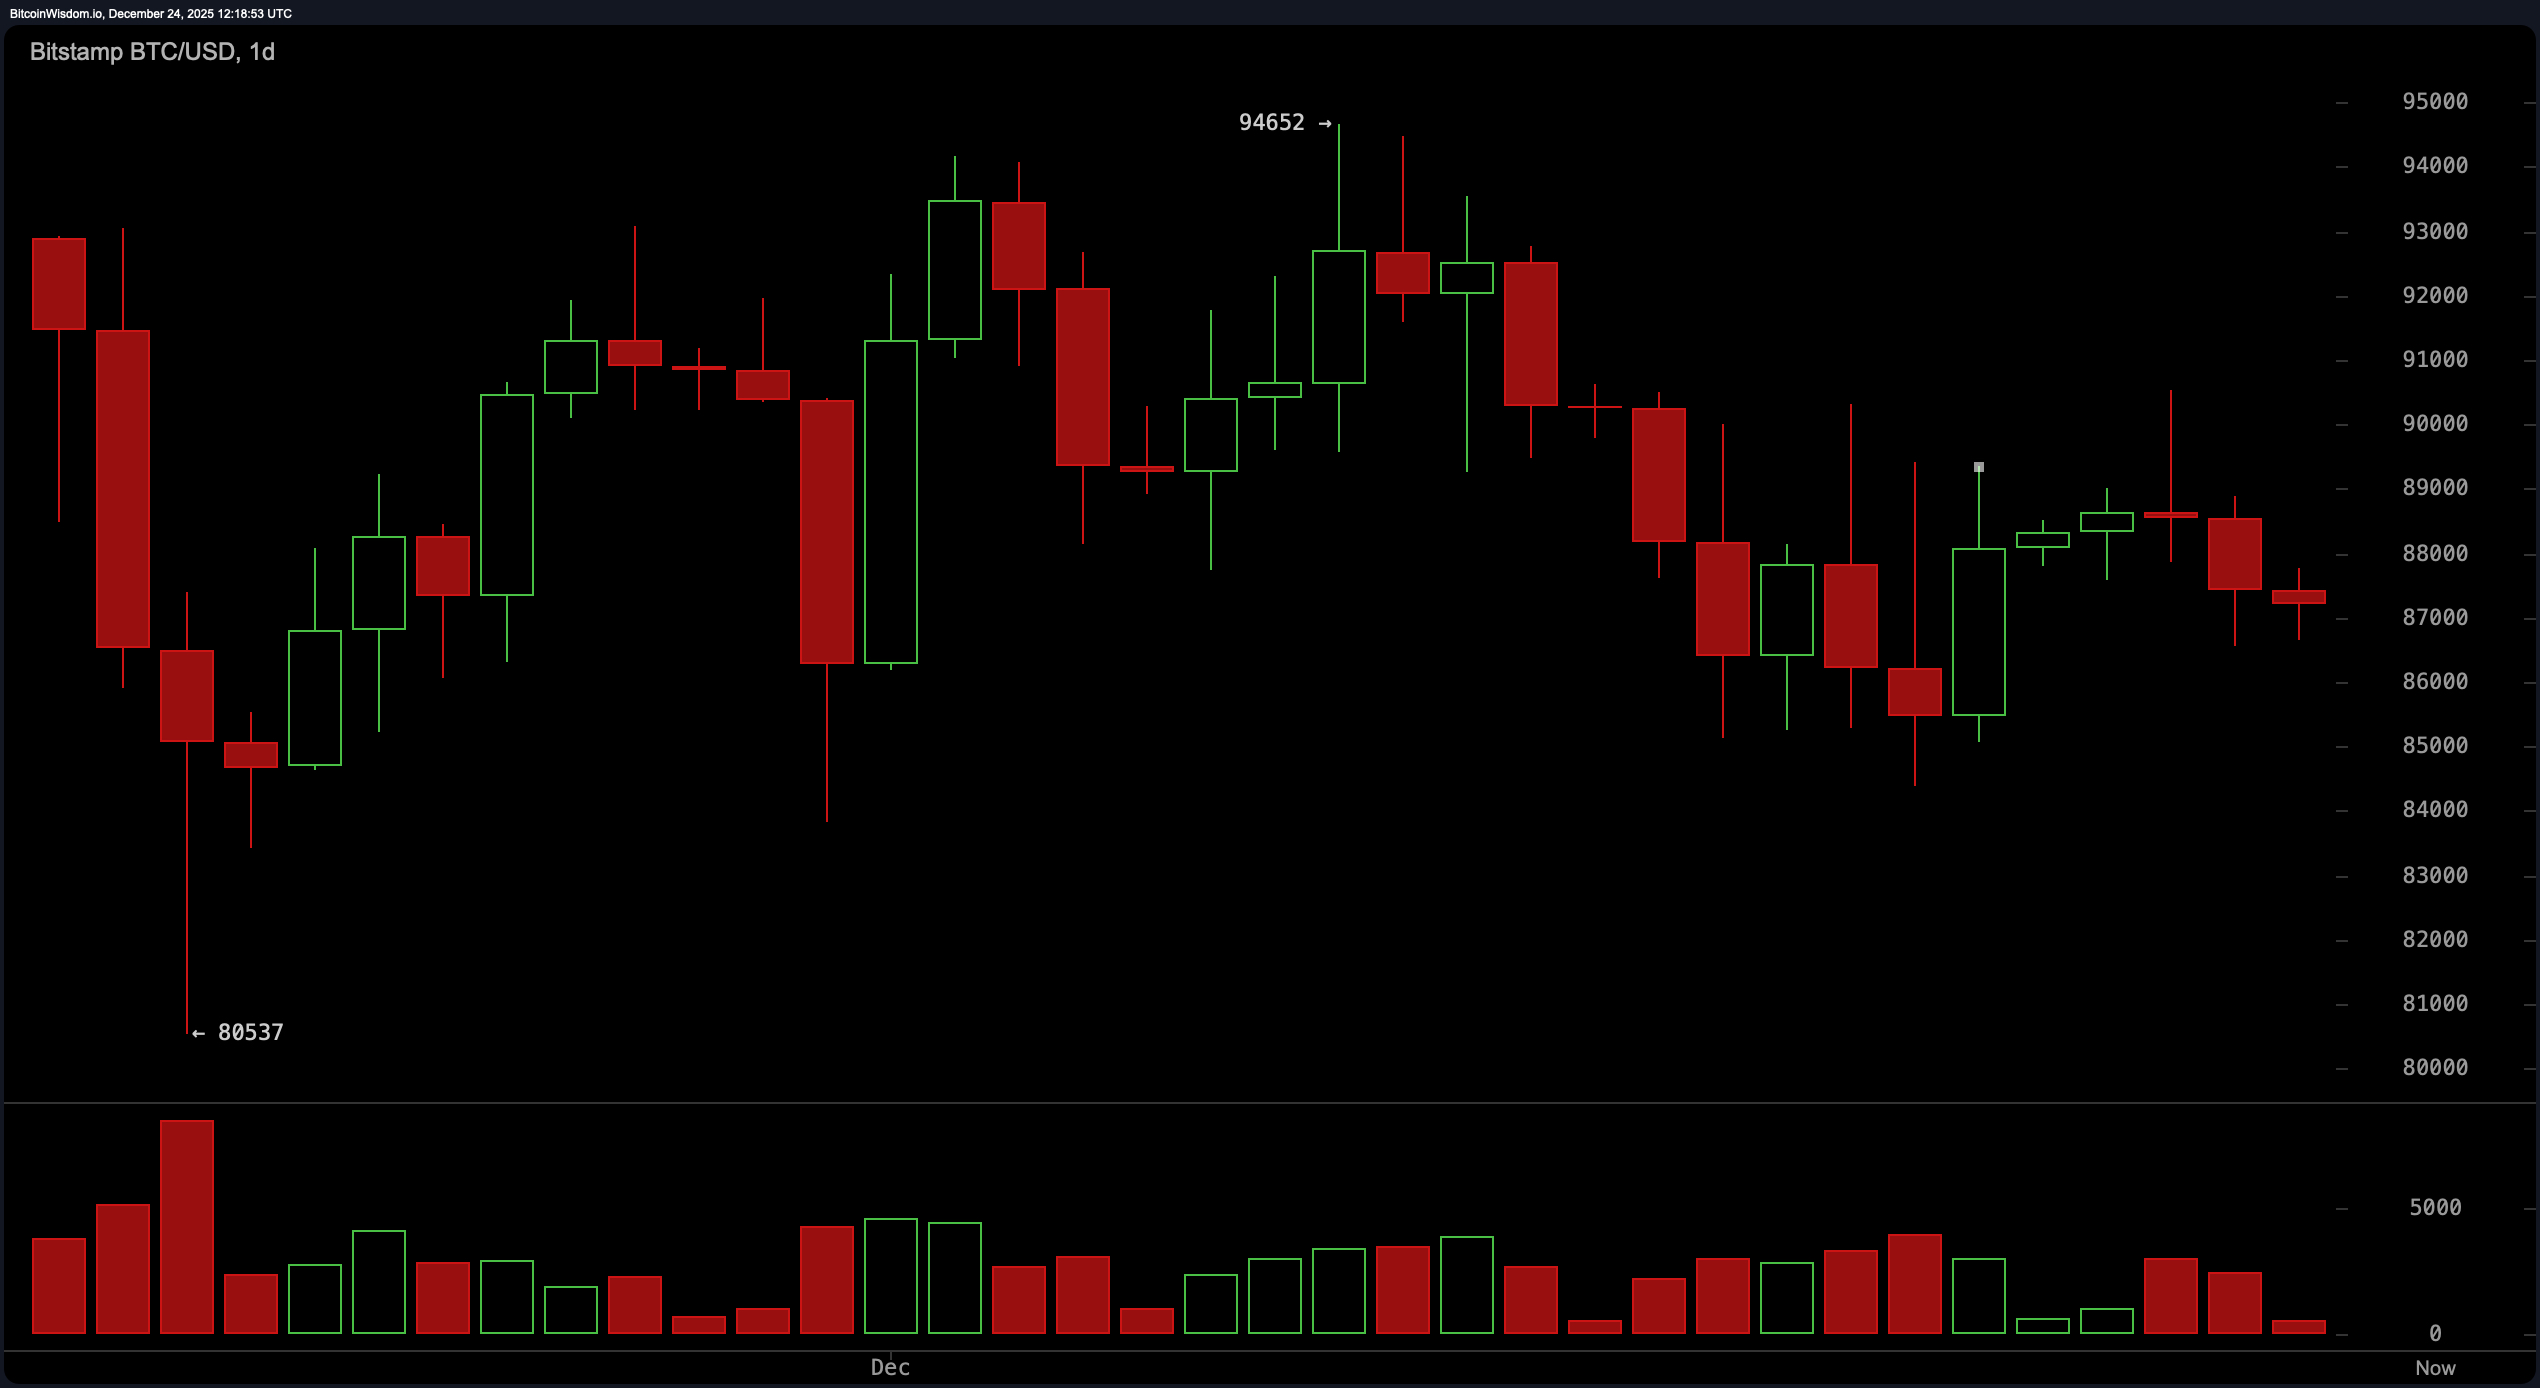
BTC/USD 1-day chart via Bitstamp for December 24, 2025.
Zooming in on the 4-hour chart, the structure is leaning from bearish to neutral after repeated rejections near the $89,000 to $90,000 zone. The drop to its highest since Dec. 22 and the surge in selling on the decline indicate that downside pressure has not completely eased heading into the holiday season. That said, the price action around $86,000 to $87,000 suggests that some absorption is occurring, with the candlestick shrinking as volatility decreases. In other words, participants are waiting for confirmation rather than blindly charging something with low liquidity.
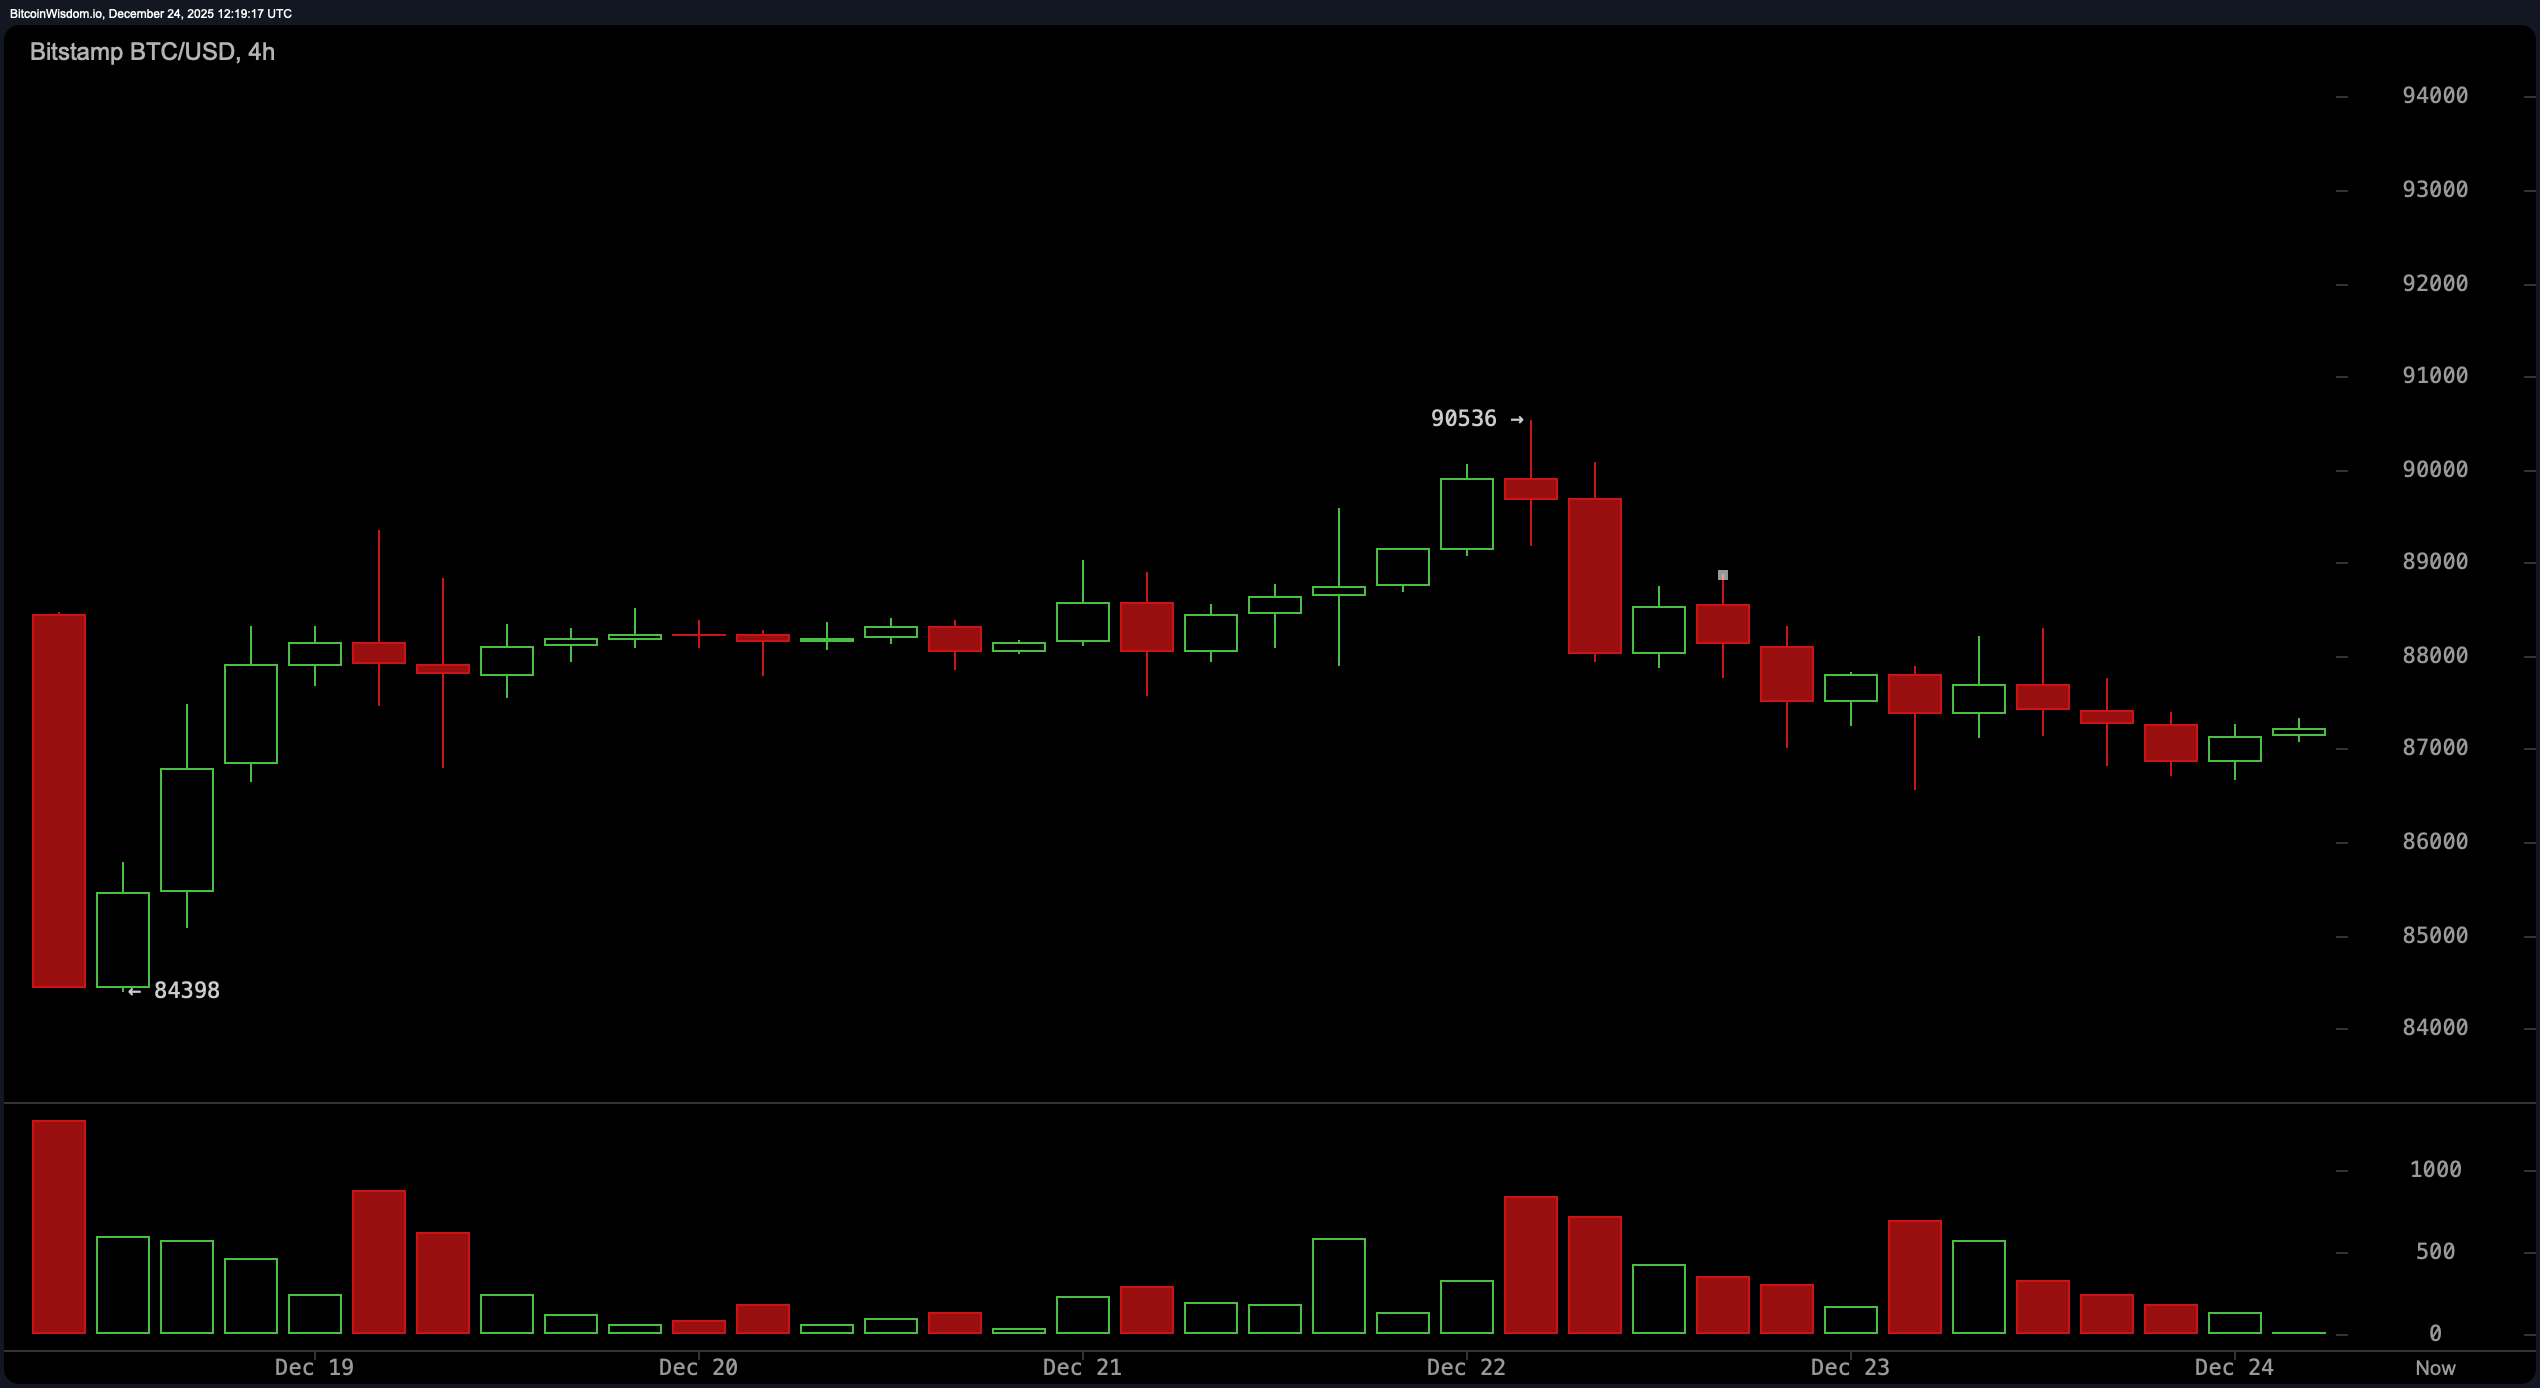
BTC/USD 4-hour chart via Bitstamp on December 24, 2025.
The hourly chart adds nuance rather than drama. Bitcoin has been hovering around $87,000 to $87,500 on low volume, small candlesticks, a typical sign of short-term depletion after a pullback. This type of compression often precedes sharper movements, but the directionality remains unresolved. Now think of it as a coiled spring rather than a wrapped one. Intraday participants seem content to let the price reveal their hand rather than forcing a narrative.
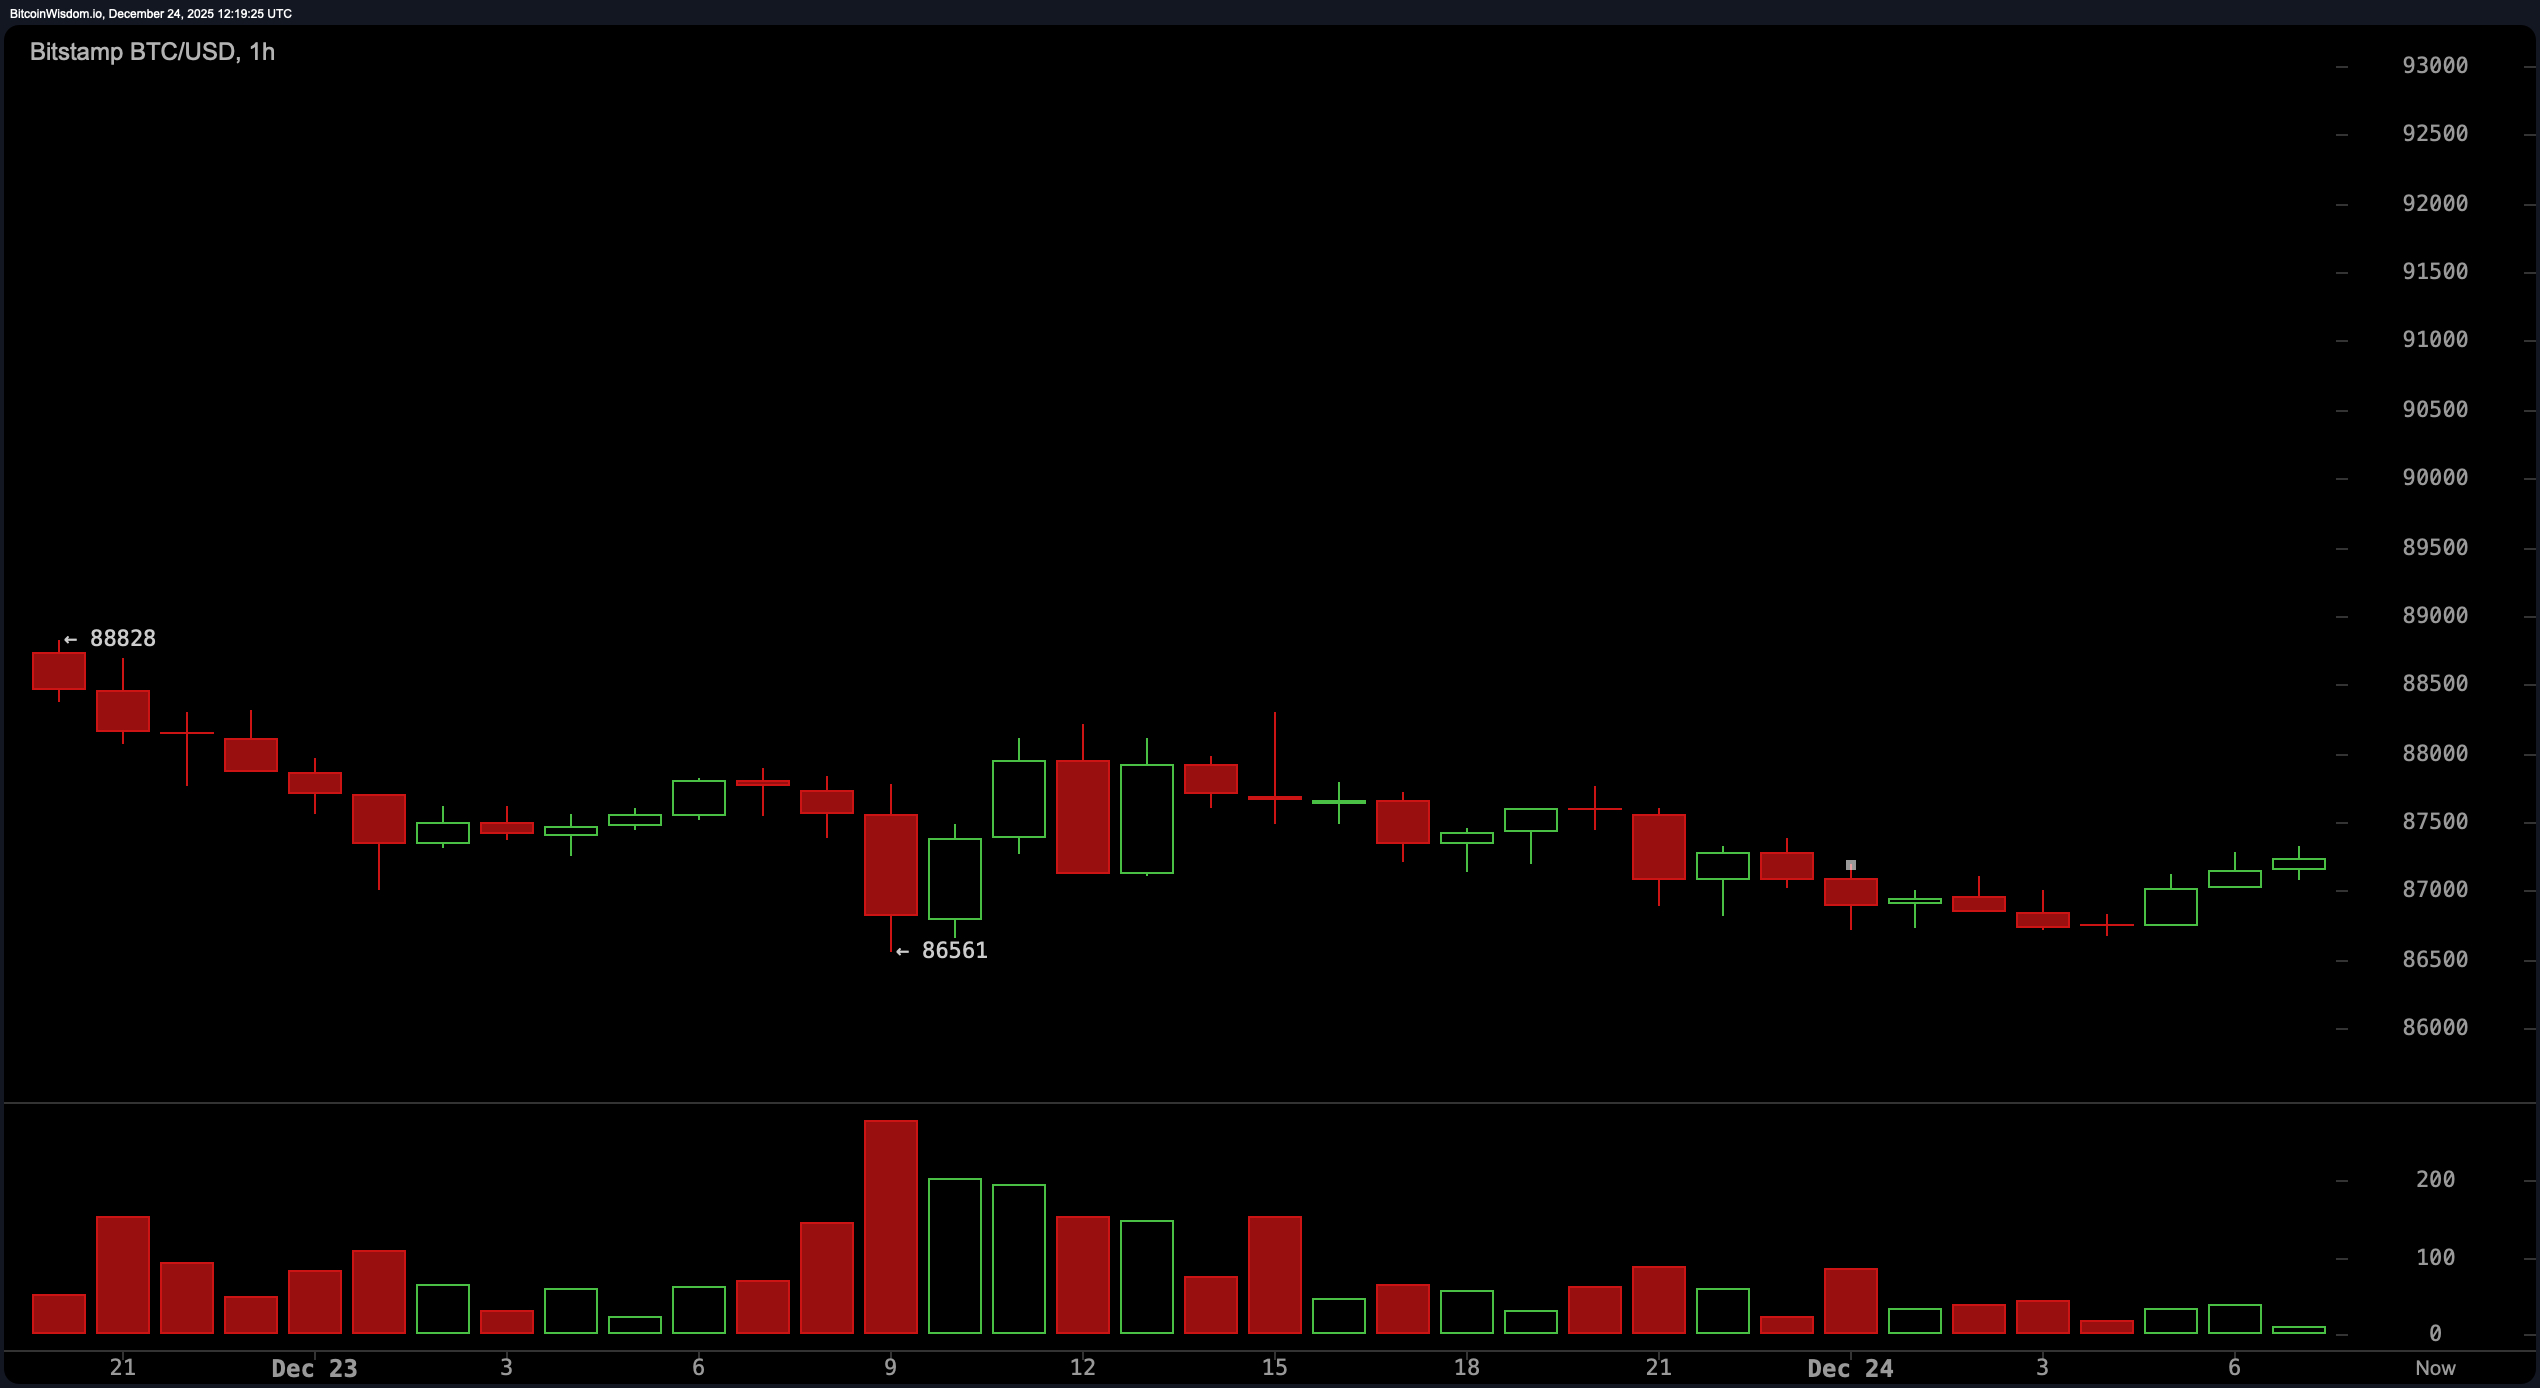
BTC/USD 1 hour chart via Bitstamp for December 24, 2025.
The oscillator on the daily timeframe emphasizes the theme of indecision. The Relative Strength Index (RSI) is 42, which is firmly in neutral territory and does not indicate excess in either direction. The Stochastic Oscillator at 34, the Commodity Channel Index (CCI) at -80, the Average Directional Index (ADX) at -23, and the Awesome Oscillator at -948 all reflect a market lacking strong conviction. While momentum and moving average convergence divergence (MACD) do suggest near-term recovery pressure, these signals are being offset by the broader trend, making this more of a cautious frown than a victory lap.
However, the moving average (MA) is decidedly less festive. All major trend gauges consisting of Exponential Moving Averages (EMAs) and Simple Moving Averages (SMAs) over 10, 20, 30, 50, 100, and 200 periods are trading above current prices. This coincidence strengthens the broader downside bias and confirms that Bitcoin is trading below a key dynamic resistance level. Until prices retake these averages with authority, the rally is likely to be treated with skepticism. So Bitcoin hasn't collapsed, but it hasn't distributed any gifts yet.
Bullish verdict:
The reason Bitcoin rises is down to resilience, not bravado. Although the price is above the key support band of $85,000 to $86,000, the 1-hour and 4-hour charts are showing signs of seller exhaustion and stabilization. Momentum and Moving Average Convergence Divergence (MACD) are both trending constructive in the short term, suggesting there is room for bailouts if volume returns and challenges nearby resistance levels. It's not fireworks, but it's about having a steady footing. And in this market, that still matters.
Bear verdict:
Arguments to the contrary are based on trends, and trends tend to win arguments. Bitcoin remains below all major exponential moving averages (EMAs) and simple moving averages (SMAs) from the short-term 10 period to the long-term 200 period, reinforcing the dominant downward bias. The daily structure shows lower highs, weakening volume, and a failed attempt to regain higher territory above the $90,000 area. Until prices convincingly return to that range, the bull market risks looking more like seasonal mirth than sustained strength.
Frequently asked questions 🎄
- What is the price of Bitcoin today on Christmas Eve 2025?
Bitcoin is trading at $87,234 and remains within a narrow intraday range as traders monitor key technical levels. - Is Bitcoin currently showing a bullish or bearish trend?
Technical analysis suggests a mixed outlook, with short-term stabilization but widespread downward pressure still present. - What are Bitcoin's major support and resistance levels?
Immediate support lies around $85,000-86,000, while resistance remains solid near $89,000-90,000. - Why is Bitcoin trading sideways despite high market interest?
Weak volume, a neutral oscillator, and a price below major moving averages have kept Bitcoin performing well.