Despite the tightening macro environment, Ethereum continues to show resilience in early 2026. Despite geopolitical uncertainty in the Middle East, ongoing supply chain disruptions, and U.S.-China tensions shaking up global risk appetite, crypto markets have remained surprisingly stable.
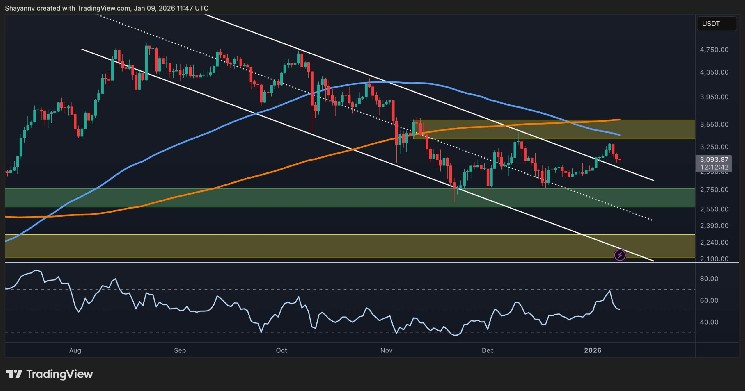
Ethereum Price Analysis: Daily Chart
On the daily chart, ETH has broken out of a broad descending channel. After a strong rebound from the green demand zone around $2,600 in mid-December, the price managed to regain the psychological mark of $3,000. However, the rally stalled just below the $3,500 resistance zone, which coincides with both the 200-day and 100-day moving averages. This zone has acted as a strong supply wall in recent months.
The RSI showed strong momentum during the rebound, but has started to fall, suggesting that the rally may be losing momentum. If the bulls are unable to push above the channel resistance and moving averages, the $2,600 support zone could be revisited. On the other hand, if we can break out cleanly above $3,500, the medium-term structure will become bullish and the next supply zone will be around $4,000.

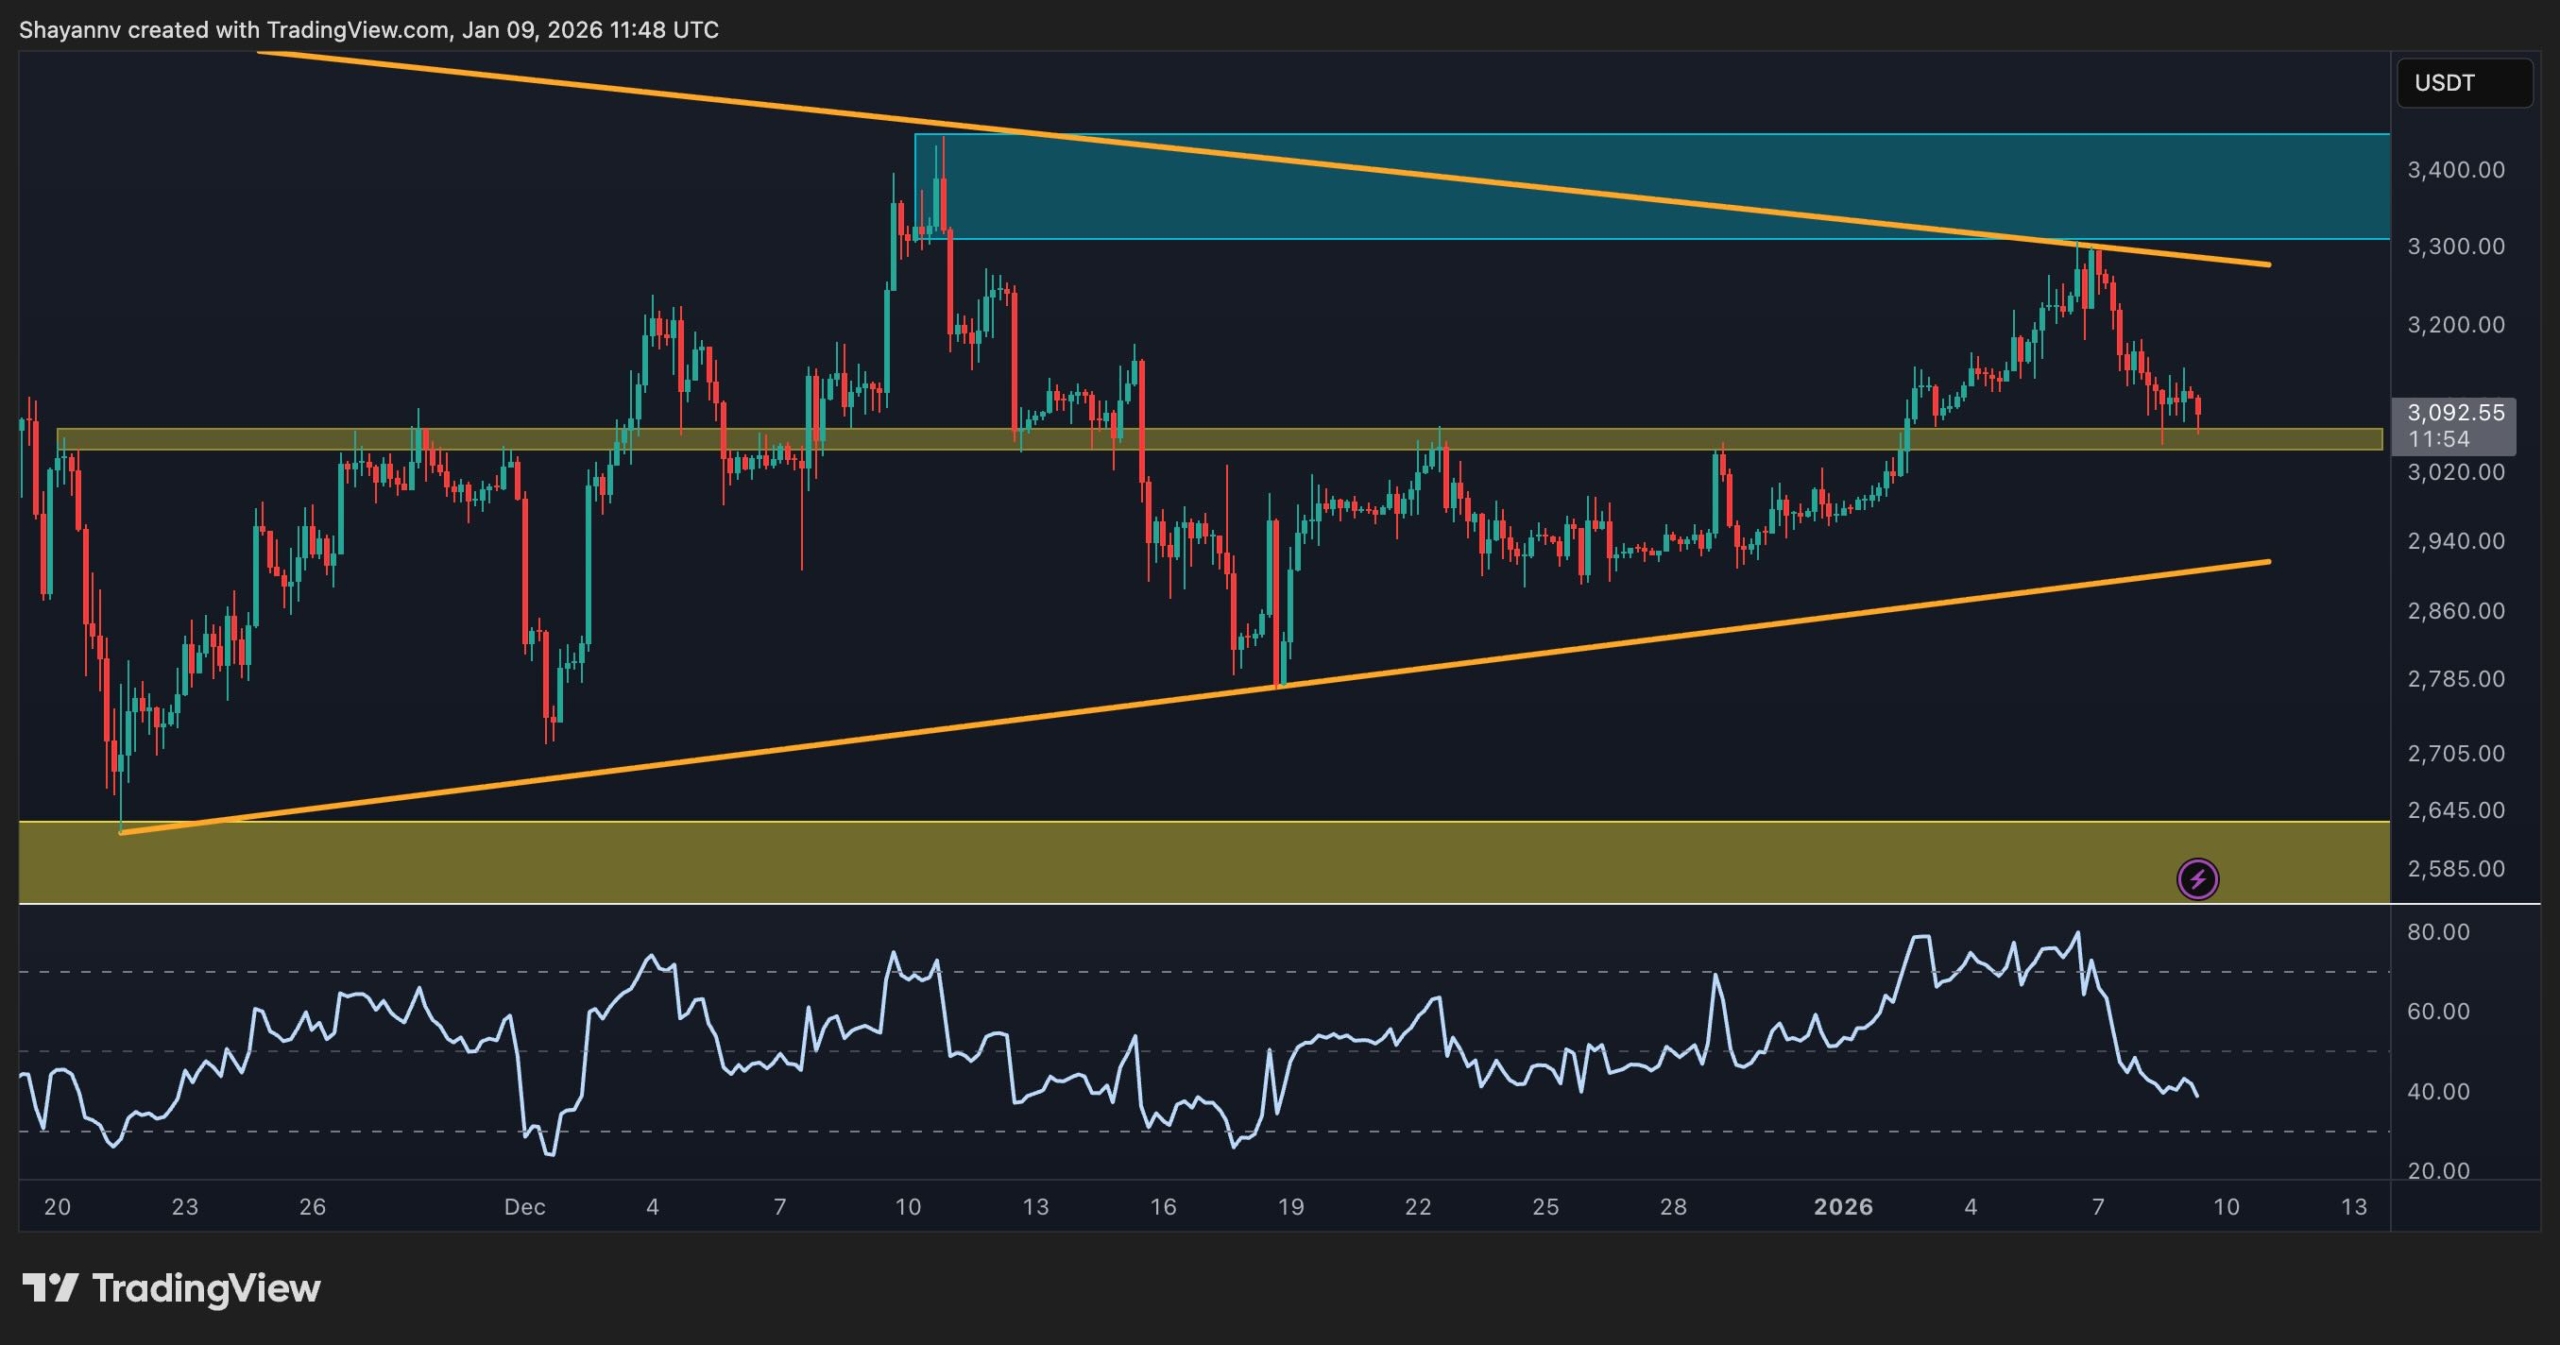
ETH/USDT 4 hour chart
If we zoom in on the 4H chart, the price trend is a symmetrical triangle with clear lows and lows centered around the $3,000 zone. This not only indicates the balance of power between buyers and sellers, but also indicates the possibility of a breakout move in the coming days. The bottom of the triangle is located near $2,900, and the upper trendline caps the price at just under $3,300.
The asset is currently retesting triangle support after a small pullback. If buyers maintain this level, there is a possibility of another challenge to the upper limit. However, a breakdown from the lower trend line could trigger a fall to the $2,600-$2,500 support band. The RSI for this time frame has also eased from overbought levels and is once again below 50, which could provide short-term momentum for sellers if support breaks.
sentiment analysis
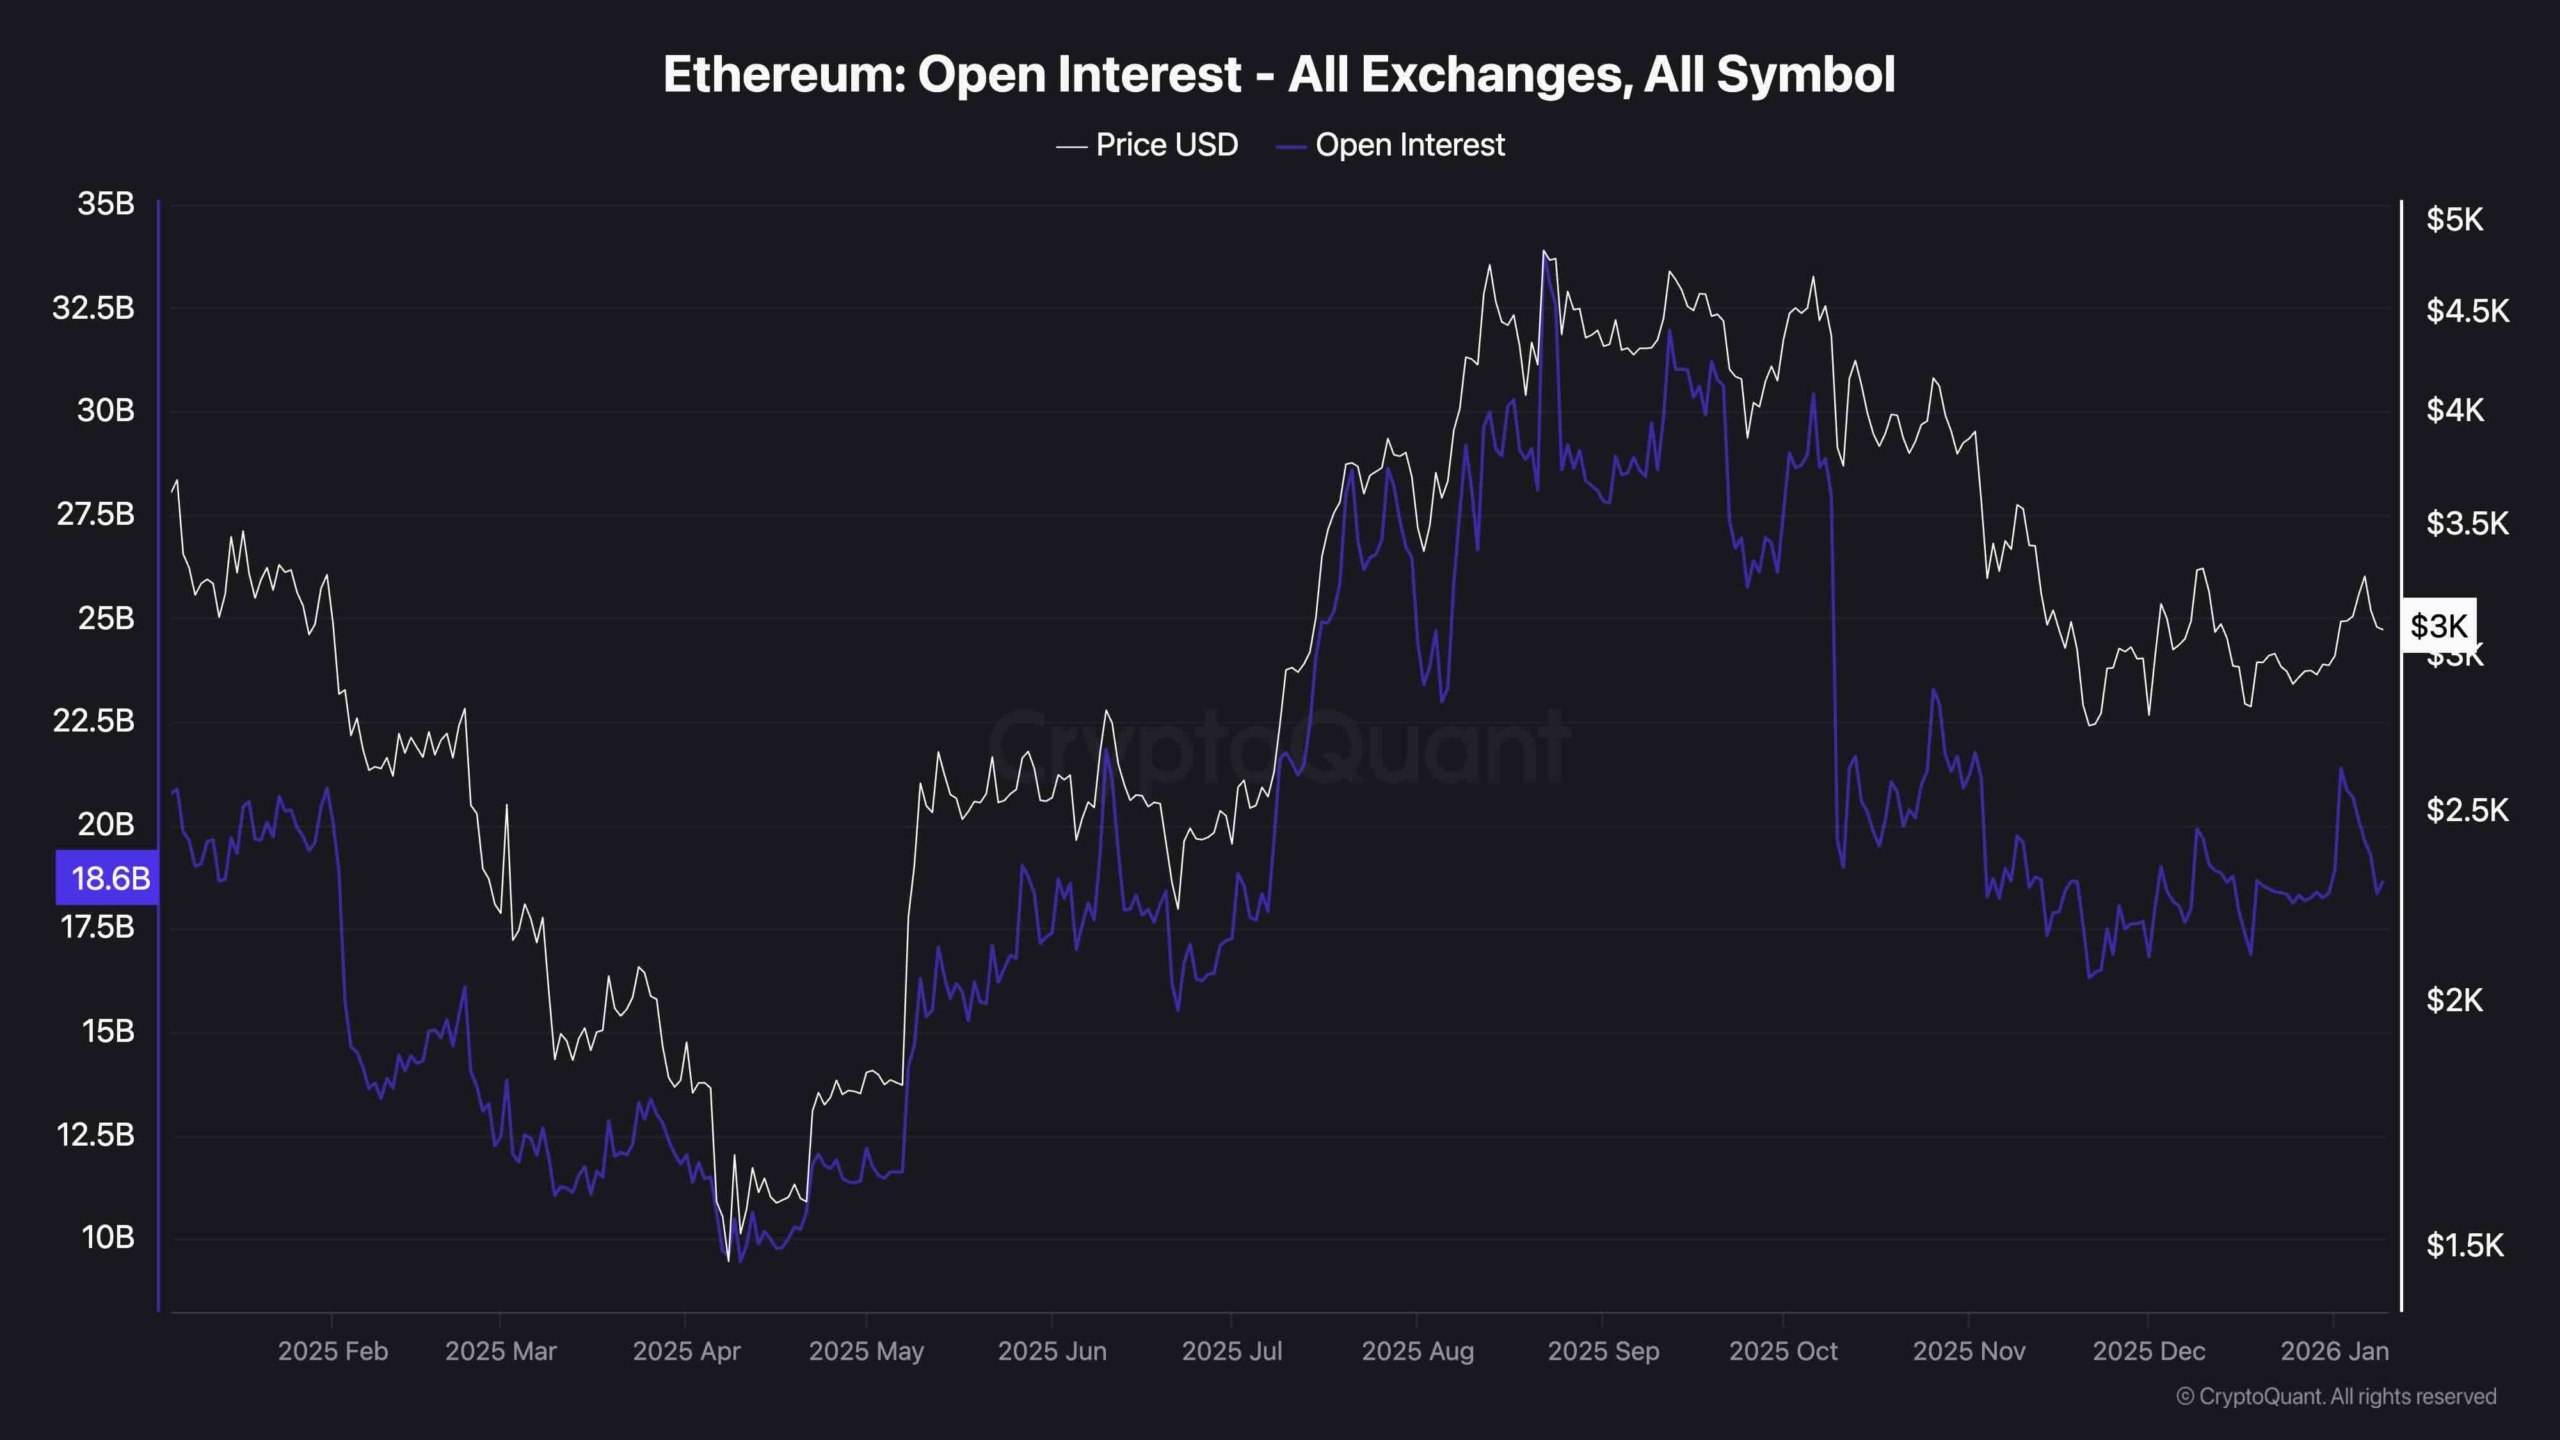
Looking at the Ethereum open interest charts across all exchanges, we see that OI is still around $18 billion, although down from its peak in Q3 2025. This suggests that while traders are still actively participating in the market, there is no sign of overwhelming leverage. Although the recent price rebound from the December lows did not cause a spike in OI, this is considered healthy as liquidations are less likely once volatility returns.
Overall market sentiment remains cautiously optimistic. ETH has managed to avoid the long squeeze seen in other altcoins. That said, with BTC's dominance rising and attention returning to the ETF story, Ethereum may lag in the short term unless it can break through key resistance levels on strong volume.