

- Ethereum price is driving a short-term consolidation trend that resonates within a symmetrical triangle pattern formation.
- The notable spike in open interest associated with Ethereum futures contracts indicates that the speculative power of the price is increasing again.
- ETH price is trading below its 100-day and 200-day exponential moving averages, suggesting that the asset's long-term trend is bearish.
Ethereum price fell 3.94% during US market hours on Wednesday and is currently trading at $3,168. The selling pressure likely came as a reset after the broad market recovery witnessed by investors during the first seven days of 2026. While this discount signals the risk of a prolonged price correction, it also indicates that institutional investors have high confidence in ETH. Will the top altcoins hold $3,000?
ETH price volatility increases as institutional buying offsets short-term weakness
In the first seven days of 2026, Ethereum price made a remarkable recovery from $2,902 to its recent high of $3,307, registering an increase of 13.26%. This rise coincided with a recovery in the broader crypto market, with Bitcoin attempting to regain the $90,000 level.
However, the rebound after the recovery has seen ETH rise to $3,169, raising concerns that the correction trend is still in the minds of retailers. Despite Ethereum’s value falling by 3.88% to around $3,148, major financial institutions are increasing their holdings of the asset.
On-chain tracking revealed that World Liberty Financial withdrew 162.69 wrapped Bitcoin units worth $14.98 million from the Aave lending protocol and changed focus. A portion of it, in this case 27.12 WBTC worth $2.5 million, was exchanged for 770.6 ETH coins.
Meanwhile, asset management firm BlackRock participated in the cryptocurrency party for the third day in a row, acquiring 9,619 Bitcoin worth $878 million and 46,851 Ethereum units worth $149 million. This activity reflects sustained interest from large buyers despite market fluctuations.
Additionally, the open interest associated with ETH futures contracts recorded a notable spike in early 2026. Since last week, OI value has rebounded from $36 million to $42 billion, according to Coinglass data.
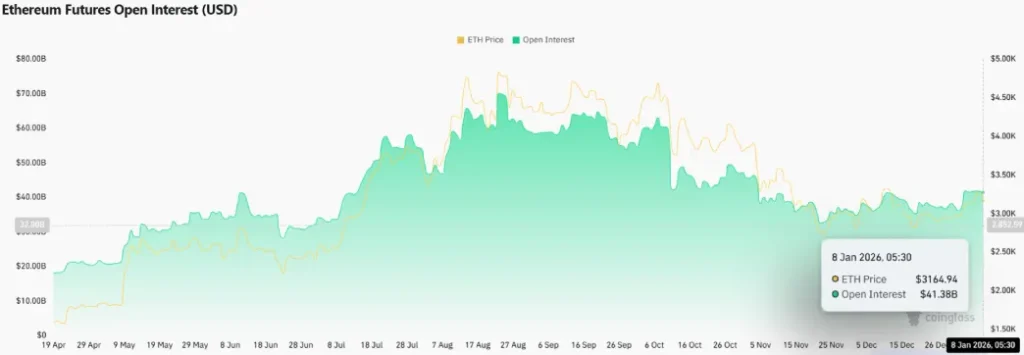
This indicates that capital inflows into the derivatives market is increasing, indicating that price volatility is expected to increase in the future.
Key breakout failure prolongs Ethereum price consolidation
Over the past two months, Ethereum price has shown a consolidation trend that resonates within two reversal trend lines. This dynamic resistance and support formed the familiar continuous pattern of symmetrical triangles.
Chart setups typically emerge after a directional trend, allowing market participants to regain depleted momentum before making the next leap. On Tuesday, Ethereum price attempted a bullish breakout from the top of the pattern. However, the breakout failed and the price re-entered the triangle zone.
The Relative Strength Index (RSI), which measures momentum, has fallen to 56%, highlighting a slight slowdown in the bull market's momentum.
This false breakout should accelerate the selling pressure and cause the ETH price to decline by 7.15% to reach the bottom trendline at $2,939. A potential bearish break below this support will further strengthen the breakdown and Ether will challenge $2,600.
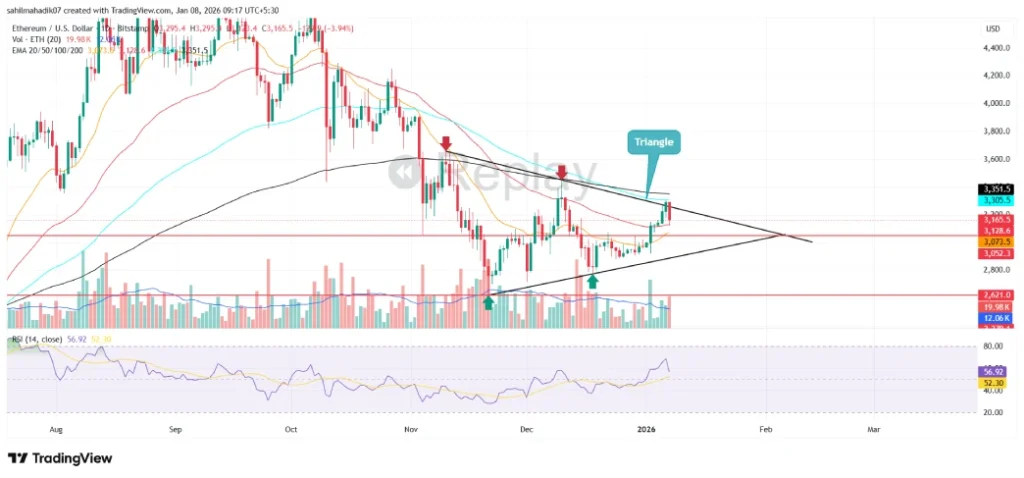
Conversely, an upside breakout from the 200-day EMA overhead will signal a bullish reversal for ETH coin.
Also read: Trump-backed World Liberty Financial (WLFI) seeks banking license