

The market is under clear risk-off pressure, and today's Ethereum cryptocurrency reflects heavy selling in an environment dominated by fear and increased volatility.
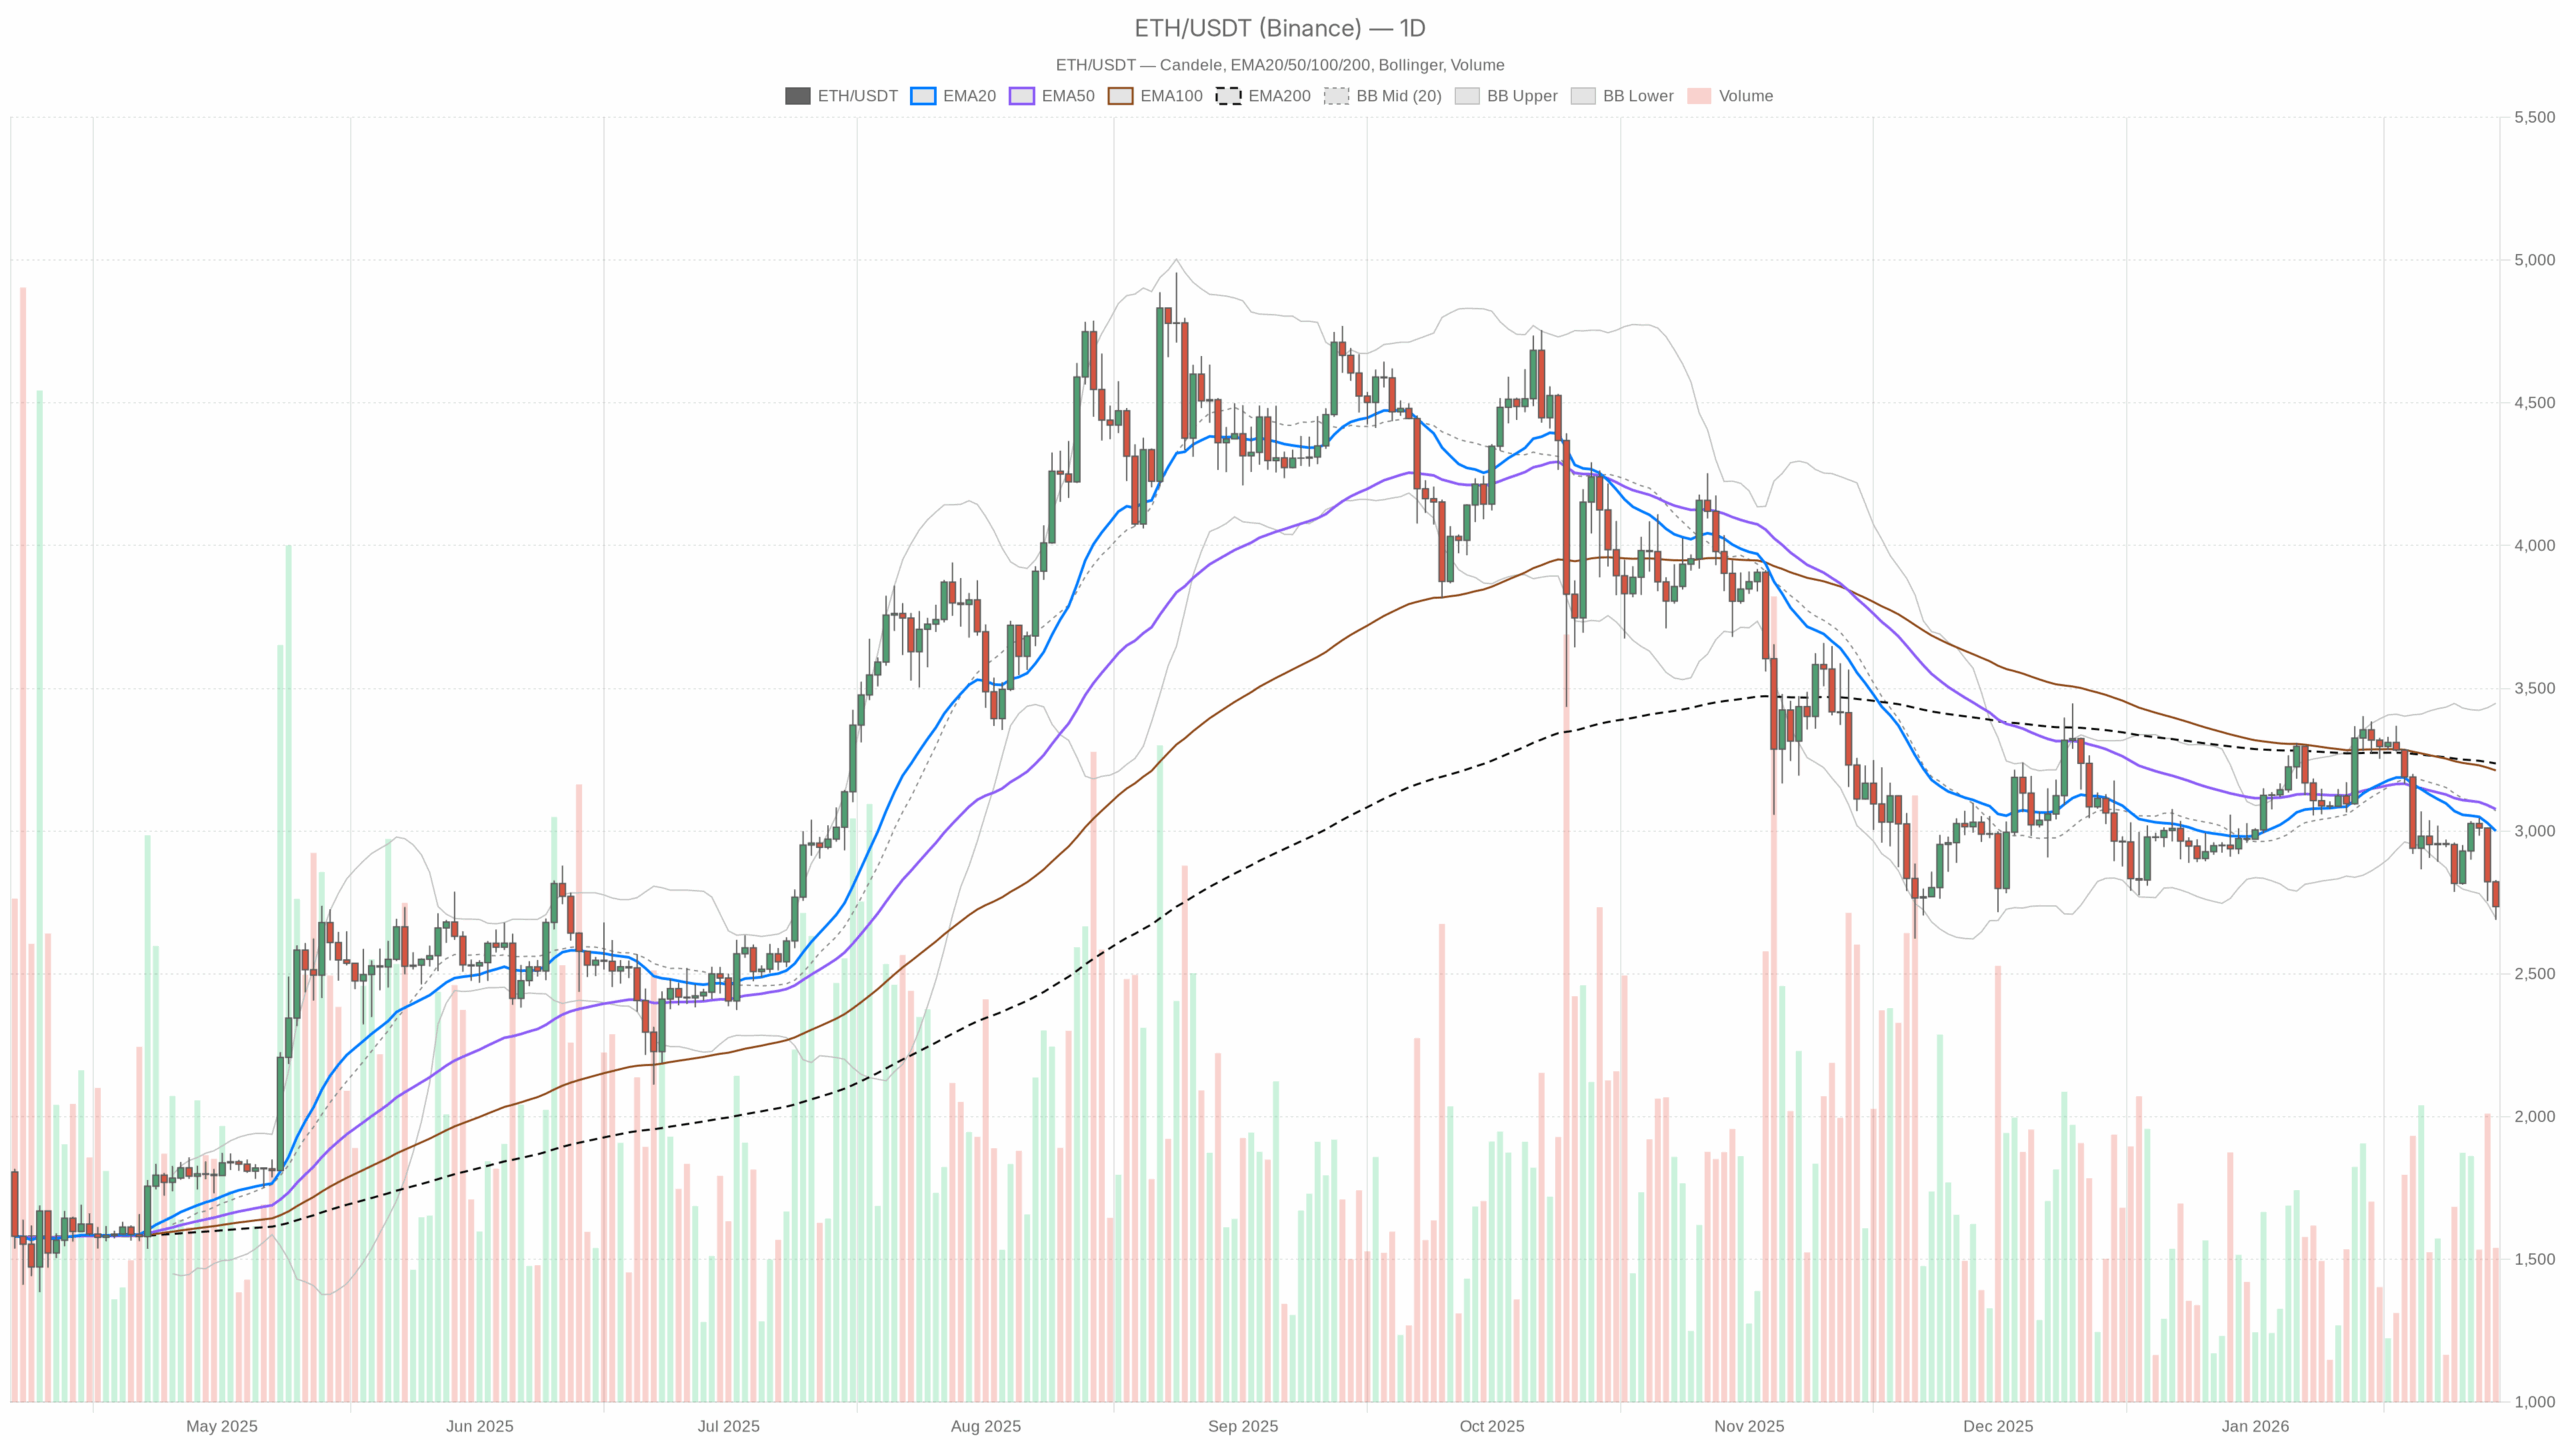
$ETH/USDT — Daily chart with candlesticks, EMA20/EMA50, and volume.
Daily chart: main scenario and bearish bias
Ethereum (ETHUSDT) is being traded $2,735 After the rapid outflow of the entire cryptocurrency complex. The background is clearly risk-off: the market capitalization of cryptocurrencies is almost decreasing 6% in 24 hours, $BTC dominance is back on top 57%the fear and greed index is 16 – Extreme fear. So this is not just something; $ETH The problem; it's a stage of widespread risk aversion.
The dominant forces at the moment are Trend pressure to the downsideEthereum is trading below all major daily moving averages and hugging the lower side of the Bollinger Bands. However, intraday momentum is starting to show. The first sign of fatigue. This is a typical point in a downtrend, where the market must decide to either extend to a yield leg or go for a mean-reverting rebound.
of Main scenario is bearish Based on daily time frame. $ETH The price is below the 20-day, 50-day, and 200-day EMAs, momentum indicators are negative, and volatility is rising in a downtrend structure. The bullish case from here is as of now. Counter trend rebound Rather than confirming a trend reversal.
Daily (D1) – Macro bias and structure
Price vs. EMA (trend structure)
close: $2,735.47
EMA 20: $3,000.38
EMA 50: $3,076.76
EMA200: $3,236.98
Price is trading well below all three EMAs, indicating a clear downside trend (a configuration of a mature bearish trend in price rather than a rapid shakeout). The distance to the EMA20 (around $265) highlights how aggressively the price has diverged from its short-term average. This usually means two things at once. Although the downtrend is real, it also means that the market is moving higher and higher. stretched downwardslaying the groundwork for a rebound if sellers run out of fuel.
RSI (Momentum & Stretch)
RSI14: 34.74
Although the daily RSI is below 40, it is not yet in significant oversold territory. Momentum is clearly bearish, but not in a state of extreme panic. This is consistent with the idea that Weak downtrend has room for further declineHowever, it is close enough to oversold that a sudden spike in volatility could easily push the RSI towards $20, causing a relief rally. Simply put, the bear has the initiative, but its advantages are not unlimited.
MACD (Momentum Trend)
MACD line: -71.11
Signal line: -36.38
histogram: -34.72
The MACD line is well below the signal line and both are negative, with a fairly negative histogram. it is, A phase of solid downward momentumconfirming the bearish trend indicated by the EMA. The important thing is that the histogram is very negative. This often occurs in the second half of the impulse leg. This indicates that the sellers have been pressuring hard recently and could continue if the news worsens or snap back if shorts become overcrowded.
Bollinger bands (volatility and positioning)
Middle band (20 period SMA proxy): $3,071.32
Upper band: $3,447.65
Lower band: $2,694.99
price: $2,735.47 (near lower band)
$ETH is trading just above lower bollinger bands. This means the price is near the limits of recent volatility. Simply put, the market is Aggressively factor in lower prices. When a candlestick reaches the lower band, the downtrend tends to continue, but being this close to the band suggests that an attempt at mean reversion to the midband (around $3,070) is plausible if the selling eases.
ATR (volatility regime)
ATR 14 (daily): $138.06
The daily ATR is approximately $140 and the average daily swing is approximately 5% of current price. This is a state of increased volatility; Punish sudden stops and lateness. Both sides need to accept a wider daytime range. In these situations, it is not uncommon to move between $200 and $250 per day.
Daily pivot level (reference zone)
Pivot point (PP): $2,751.04
Resistance 1 (R1): $2,813.08
Support 1 (S1): $2,673.43
Price is hovering just below the daily pivot point, sliding between PP and S1. This leaves the market in a situation where: The stance during the day is slightly bearish. On the daily map. A sustained move above $2,751 and then $2,813 would be the first sign that buyers are looking to regain near-term control. A strong loss of S1 ($2,673) would confirm that the sellers are not done yet.
4 hour/1 hour situation – momentum and fatigue
First half EMA (short-term trend)
close: $2,737.08
EMA 20: $2,795.62
EMA 50: $2,868.15
EMA200: $2,957.04
hourly trends too firmly bearishthe price is below all three EMAs. The distance between the EMAs indicates an established downward trend. There are no intraday bullish crosses yet. This confirms the daily bearish bias, but the degree of deviation from the 20 EMA once again suggests a near-term decline. Overshoot to the bottomcreating conditions suitable for a quick bounce, but not yet a complete reversal.
1H RSI (Intraday Momentum)
RSI14: 30.52
The hourly RSI is hovering just above oversold. Intraday sellers are putting pressure on, but we are getting closer to the point where it will be difficult to maintain it with each further drop. usually located here Scalpers start to lose their extremeson the other hand, swing traders still respect downtrends.
First half MACD (intraday momentum)
MACD line: -51.93
Signal line: -51.26
histogram: -0.67
In the first half, both the MACD and the signal are in deep negative territory, but the histogram is only slightly negative. it tells us the following The downward momentum may be stabilizing. Instead of accelerating. The bears are still in control, but we may be past the stage of aggressive acceleration for this immediate swing.
Bollinger bands and volatility in the first half of the year
Middle band: $2,792.57
Upper band: $2,900.09
Lower band: $2,685.06
price: $2,737.08
$ETH is traded at lower half Bollinger envelope value per hour, but not fixed to the lower band. It matches the following markets: Weak but taking a short break Rather than surrender completely. There is room to push towards $2,790-$2,800 without changing the overall trend.
1H ATR and pivot
ATR 14 (1H): $35.88
Pivot point (PP): $2,736.11
R1: $2,749.38
S1: $2,723.82
Hourly ATR around $36 indicates active intraday fluctuations. Currently, the price is located at an intraday pivot, which is decision area. A push above R1 indicates a short-term relief rebound. Once below S1, the intraday downtrend remains intact.
15m Execution Context – Microstructure
15m EMA (ultra short term flow)
close: $2,738.06
EMA 20: $2,742.12
EMA 50: $2,768.74
EMA200: $2,871.22
On the 15-minute chart, the price is slightly below the EMA20, but well below the EMA50 and EMA200. The shortest flow is try to stabilize;Although the market is no longer actively below the EMA20, the broader intraday structure remains bearish. This is a typical phenomenon where the market pauses after a decline.
15m RSI
RSI14: 46.17
The 15m RSI is near the center of the range and is giving off a signal. Neutral short-term momentum. Sellers no longer have the same grip as before. Short-term buyers are starting to match with them in this micro timeframe. This often precedes a local consolidation range or short squeeze if the bears overstay.
15mMACD
MACD line: -8.35
Signal line: -10.86
histogram: +2.51
Now I finally see something small bullish change: The MACD line is crossing up towards the signal and the histogram has turned positive. The momentum in the shortest time frame has changed from a push sell to a potential rebound attempt. Importantly, this execution signal onlynot a change in the trend on the higher time frame.
15m Bollinger Bands, ATR, Pivot
Middle band: $2,741.76
Upper band: $2,769.59
Lower band: $2,713.92
ATR 14 (15m): $15.33
Pivot point (PP): $2,736.34
R1: $2,739.78
S1: $2,734.62
Prices are fluctuating around the mid-band and 15 meter pivot, with ATR relatively tight. it shows that short term equilibrium zone Market participants are revaluing after the previous dumping. For active traders, this is a typical area for planning entries and exits, but does not in itself determine the direction of higher timeframes.
Market environment and news background
The macro crypto environment was on the defensive, with market capitalization down nearly 6% in 24 hours, while volume surged over 66%. it's a classic Mass risk off Action. $BTC The 57% advantage shows that capital is rotating away from altcoins and into Bitcoin. $ETH.
On the regulatory front, the U.S. Senate is moving forward with regulations. Virtual currency regulation bill Uncertainty is rising with expanded CFTC oversight and looming White House negotiations with banks and crypto companies. When regulatory headlines are announced at a technically weak stage, markets typically Additional risk premium pricewhich is exactly what we're seeing now. What matters is whether the end result is perceived as clarity, which is ultimately constructive, or as a structurally bearish constraint on speculative flows.
Ethereum bullish scenario
In a constructive case, you're essentially betting on: Mean reversal within a broader downtrendat least at first.
Bounce pass: The short-term timeframe already indicates an initial rotation. The 15 million MACD is trending up, the 15 million RSI is neutralizing, and the price is stabilizing around the intraday pivot. A typical bounce sequence looks like this:
1. Hold it up. S1 first half ($2,723) and daily near the S1 region. $2,673avoid new lows.
2. Collect and retain H1 pivoted at approximately $2,736Push towards. R1 2,749 to $2,813 (hourly and daily resistance bands).
3. Stretch towards. EMA20 first half is approximately $2,796 And there is a possibility of a mid-Bollinger Band near the daily Bollinger Band. $3,070 If the bounce develops into a more complete squeeze.
When this is expanded you will see:
– daily RSI Go back towards 40-45 and make sure the momentum is steady.
– 1H MACD Histogram The price turned positive, indicating that the bulls have taken short-term control.
– Prices are starting to end Exceeds first half EMA20 Don't be limited by it, be consistent.
What invalidates the bullish scenario?
A nice break and end of the day Less than $2,673 (Daily S1) If the RSI slides deeper into the 20s, the simple bounce theory will become invalid and the door will open to a more aggressive leg down. If the price rejects sharply from the $2,800-2,850 zone and falls below the first-half pivot, it would indicate that the bears are still in full control.
Ethereum bearish scenario
The current structure favors the bears. The bearish scenario is that this current pause is just a pause. Rest before putting your next foot down.
Continuation path:
1. Price fails to sustain above intraday pivot (~$2,736); lower than $2,724 in the first half of S1.
2. Seller pushes $ETH to S1 daily for $2,673 Then start closing the candles underneath.
3. Losing this level will widen the downtrend, with the daily RSI firmly below 30 and the daily MACD histogram remaining significantly negative or even widening.
Under this path, the market will move from a controlled trend to a potential trend. surrender stage. The price could then explore pockets of illiquidity well below $2,600 and ATR could extend beyond the current $140 range.
To maintain confidence in the continuation of the bear market, bears want to see the following:
– 1 hour RSI Despite the bounce, it remains below 40.
– 15mMACD It fails to build a sustained positive histogram and reverts.
– Repeat price action Reject 1H EMA20 to EMA50 band ($2,800-$2,870) per bounce.
What would invalidate the bearish scenario?
if $ETH Able to produce and maintain a breakback that exceeds the above $2,850 (It almost enters the EMA50 zone for the first half of the year) and then begins to close the daily candlesticks above that. Daily EMA20 is around $3,000the current downtrend will lose its edge. At that point, the narrative shifts from a rift sell to a new uptrend in a range or formation, and the clean bearish structure breaks down.
How to think about positioning now
Across all time frames, Ethereum is in the following situation: Downtrend with early signs of brittle fatigue. The daily chart clearly calls out things to be wary of, including prices below all EMAs, a negative MACD, an RSI below 40, and a market environment dominated by extreme fear. However, the intraday chart is starting to show that the sellers are no longer accelerating. They are defending the land they have already won.
For traders, this is one of the most tricky environments to be in, as volatility is high, levels are tested quickly, and both sides can easily get squeezed. Trend traders typically prefer to stay consistent with the daily bearish bias and try to fade any pullback into a resistance band such as: $2,800 – $2,900. Mean-reverting traders will find value near the lower end of the Bollinger Band and will look for strong intraday confirmation, such as a reversal in the MACD or a recovery in the EMA, before venturing to the long side.
Regardless of your bias, risk management is more important here than direction. Around daily ATR $140 and around ATR per hour. $36position sizing and stop placement should reflect the fact that Ethereum can easily move several percentage points in a single session. Regulatory noise from the US will only add to the uncertainty, and the technology level could turn into an air pocket as headlines break.
In other words, today's Ethereum cryptocurrency is Bearish phase under macro pressureshort-term traders are looking for a pullback. Until the daily trend structure changes, the upside remains countertrend and vulnerable.
This section contains sponsored affiliate links. We may earn commissions at no additional cost to you.
Disclaimer: This article is a market analysis and reflects the technical and contextual views at the time of writing. This is not financial advice, an investment recommendation, or a solicitation to buy or sell any property. The cryptocurrency market is extremely volatile. Always conduct your own research and evaluate your risk tolerance before making any trading decisions.