

Bitcoin has been unable to sustain gains near the $97,970 high and continues to trade under pressure, leaving the market in a fragile short-term structure. The 4-hour chart shows a decisive rejection at the top followed by a deep retracement into the Fibonacci range.
Price has rebounded from the macro support at $60,104, but buyers have yet to reclaim the key resistance level. As a result, momentum remains limited; $BTC It is hovering around $66,900 to $67,000.
Attempt to restore upper limit of resistance level
Bitcoin is currently trading below the 0.236 Fibonacci level at $69,040, which is acting as an immediate resistance. This zone acts as the first breakout trigger for a sustained upward move. If buyers are confident and move above $69,000, the price could target the 0.382 retracement and known supply area at $74,569.
Additionally, the $79,037 level coincides with the 0.5 retracement and would confirm a broader trend change. Above that, the 0.618 Fibonacci level at $83,505 exists as strong structural resistance.
However, until then $BTC By decisively clearing $69,000, the seller maintains short-term control. The Donchian channel is adding to this caution as prices continue to approach the lower bound.
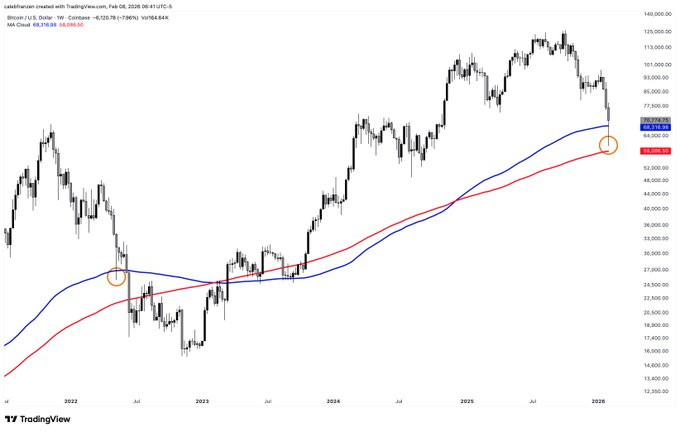
$BTC Price dynamics (Source: Trading View)
On the downside, the $65,000 to $66,000 range provides immediate short-term demand. This sector has recently contributed to the stabilization of price fluctuations.
Related: LayerZero (ZRO) Price Prediction: Can LayerZero Clear $2.46 and Extend Rally?
Nevertheless, the larger macro support at $60,104 carries more significance. A break below $60,000 could accelerate the downward momentum.
Furthermore, the average directional index near 30 suggests that the previous downtrend has maintained its strength. However, the momentum of the trend is now slowing, indicating the possibility of consolidation rather than continuation soon.
Open Interest and Spot Flows Call for Caution
Derivatives data supports a more defensive outlook. After peaking at over $80 billion during the initial rally, Bitcoin's open interest has recently declined to about $44.7 billion. This contraction reflects deleveraging and reduced speculative exposure. Each previous expansion phase ended in a sharp unwinding, signaling a forced liquidation.
In addition to that, spot flow data shows continuous net outflows over several months. The red bar is always above the green inflow and reflects the distribution pressure. Importantly, February 11th saw net outflows of $122 million, reinforcing cautious sentiment.
Related: Cardano Price Prediction: ADA Tests Multi-Month Lows As Open Interest Falls and Outflows Continue
Bitcoin technical outlook ($BTC)
Key levels remain well-defined as Bitcoin trades below short-term resistance near $69,000. Price continues to recover from the $60,104 macro support, but the structure still reflects the lower highs on the 4th hour chart.
Top level: The immediate hurdle is $69,040 (0.236 Filib). A clean breakout could open the door to $74,569 (0.382 Filib). Above that, $79,037 (0.5 Fib) becomes a key trend shift level. If the momentum increases, $BTC It is likely to expand towards $83,505 (0.618 fibnas) where major structural resistance exists.
Lower price level: $65,000-$66,000 remains the first near-term demand zone. Below that, $60,104 acts as important macro support. A decisive break below $60,000 could expose Bitcoin to a deeper retracement level and accelerate selling pressure.
The broader technical picture shows that Bitcoin is compressing after a strong directional move. The Donchian channel reflects prices approaching the lower bound, indicating prolonged weakness. On the other hand, ADX previously signaled trend strength but is now losing momentum.
From a derivatives perspective, a decline in open interest suggests deleveraging rather than aggressive accumulation. The spot outflow also reflects careful positioning.
Will Bitcoin rise further?
Bitcoin’s near-term direction depends on whether buyers have the confidence to take back $69,000. Sustained strength above this level could trigger a rescue rebound towards $74,500 and even $79,000. However, the failure to convert support at $69,000 keeps the broader bearish bias intact.
For now, $BTC Trades in a vital zone. Compression in volatility suggests that more big moves are likely to follow. Confirmation from volume, inflows and momentum indicators will determine the next leg.
Related: River Price Prediction: Spot Listings Cause 33% Rise as Rivers Test Triangle Resistance
Disclaimer: The information contained in this article is for informational and educational purposes only. This article does not constitute financial advice or advice of any kind. Coin Edition is not responsible for any losses incurred as a result of the use of the content, products, or services mentioned. We encourage our readers to do their due diligence before taking any action related to our company.