Bitcoin is about to break below an important wedge pattern, likely indicating bearish sentiment in the market. Nevertheless, prices have recharged within equilibrium, awaiting absorption by institutional investors or a deeper liquidity sweep for the next major expansion.
technical analysis
Written by Shayan
daily chart
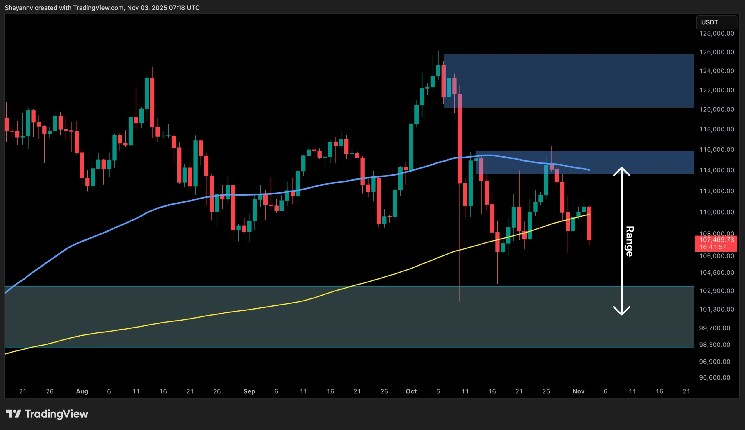
On the daily time frame, Bitcoin is decisively below its 200-day moving average of $109,000, showing notable bearish signs.
The market has repeatedly rebounded from the $103,000 to $108,000 demand zone, suggesting buyers remain active at these levels. However, a series of lows below $116,000 indicates continued pressure from the supply zone, locking the price in an equilibrium range between $105,000 and $116,000.
This structure resembles a midrange accumulation pattern, where liquidity is continually recycled between buyers and sellers before a larger directional expansion.
A decisive daily close above the 200-day moving average would indicate a bear trap and a false breakout, leading to a bullish structural change towards the $116,000 supply zone, while a breakdown below the $106,000 support could trigger a retest of the $102,000-$100,000 institutional demand block.
4 hour chart
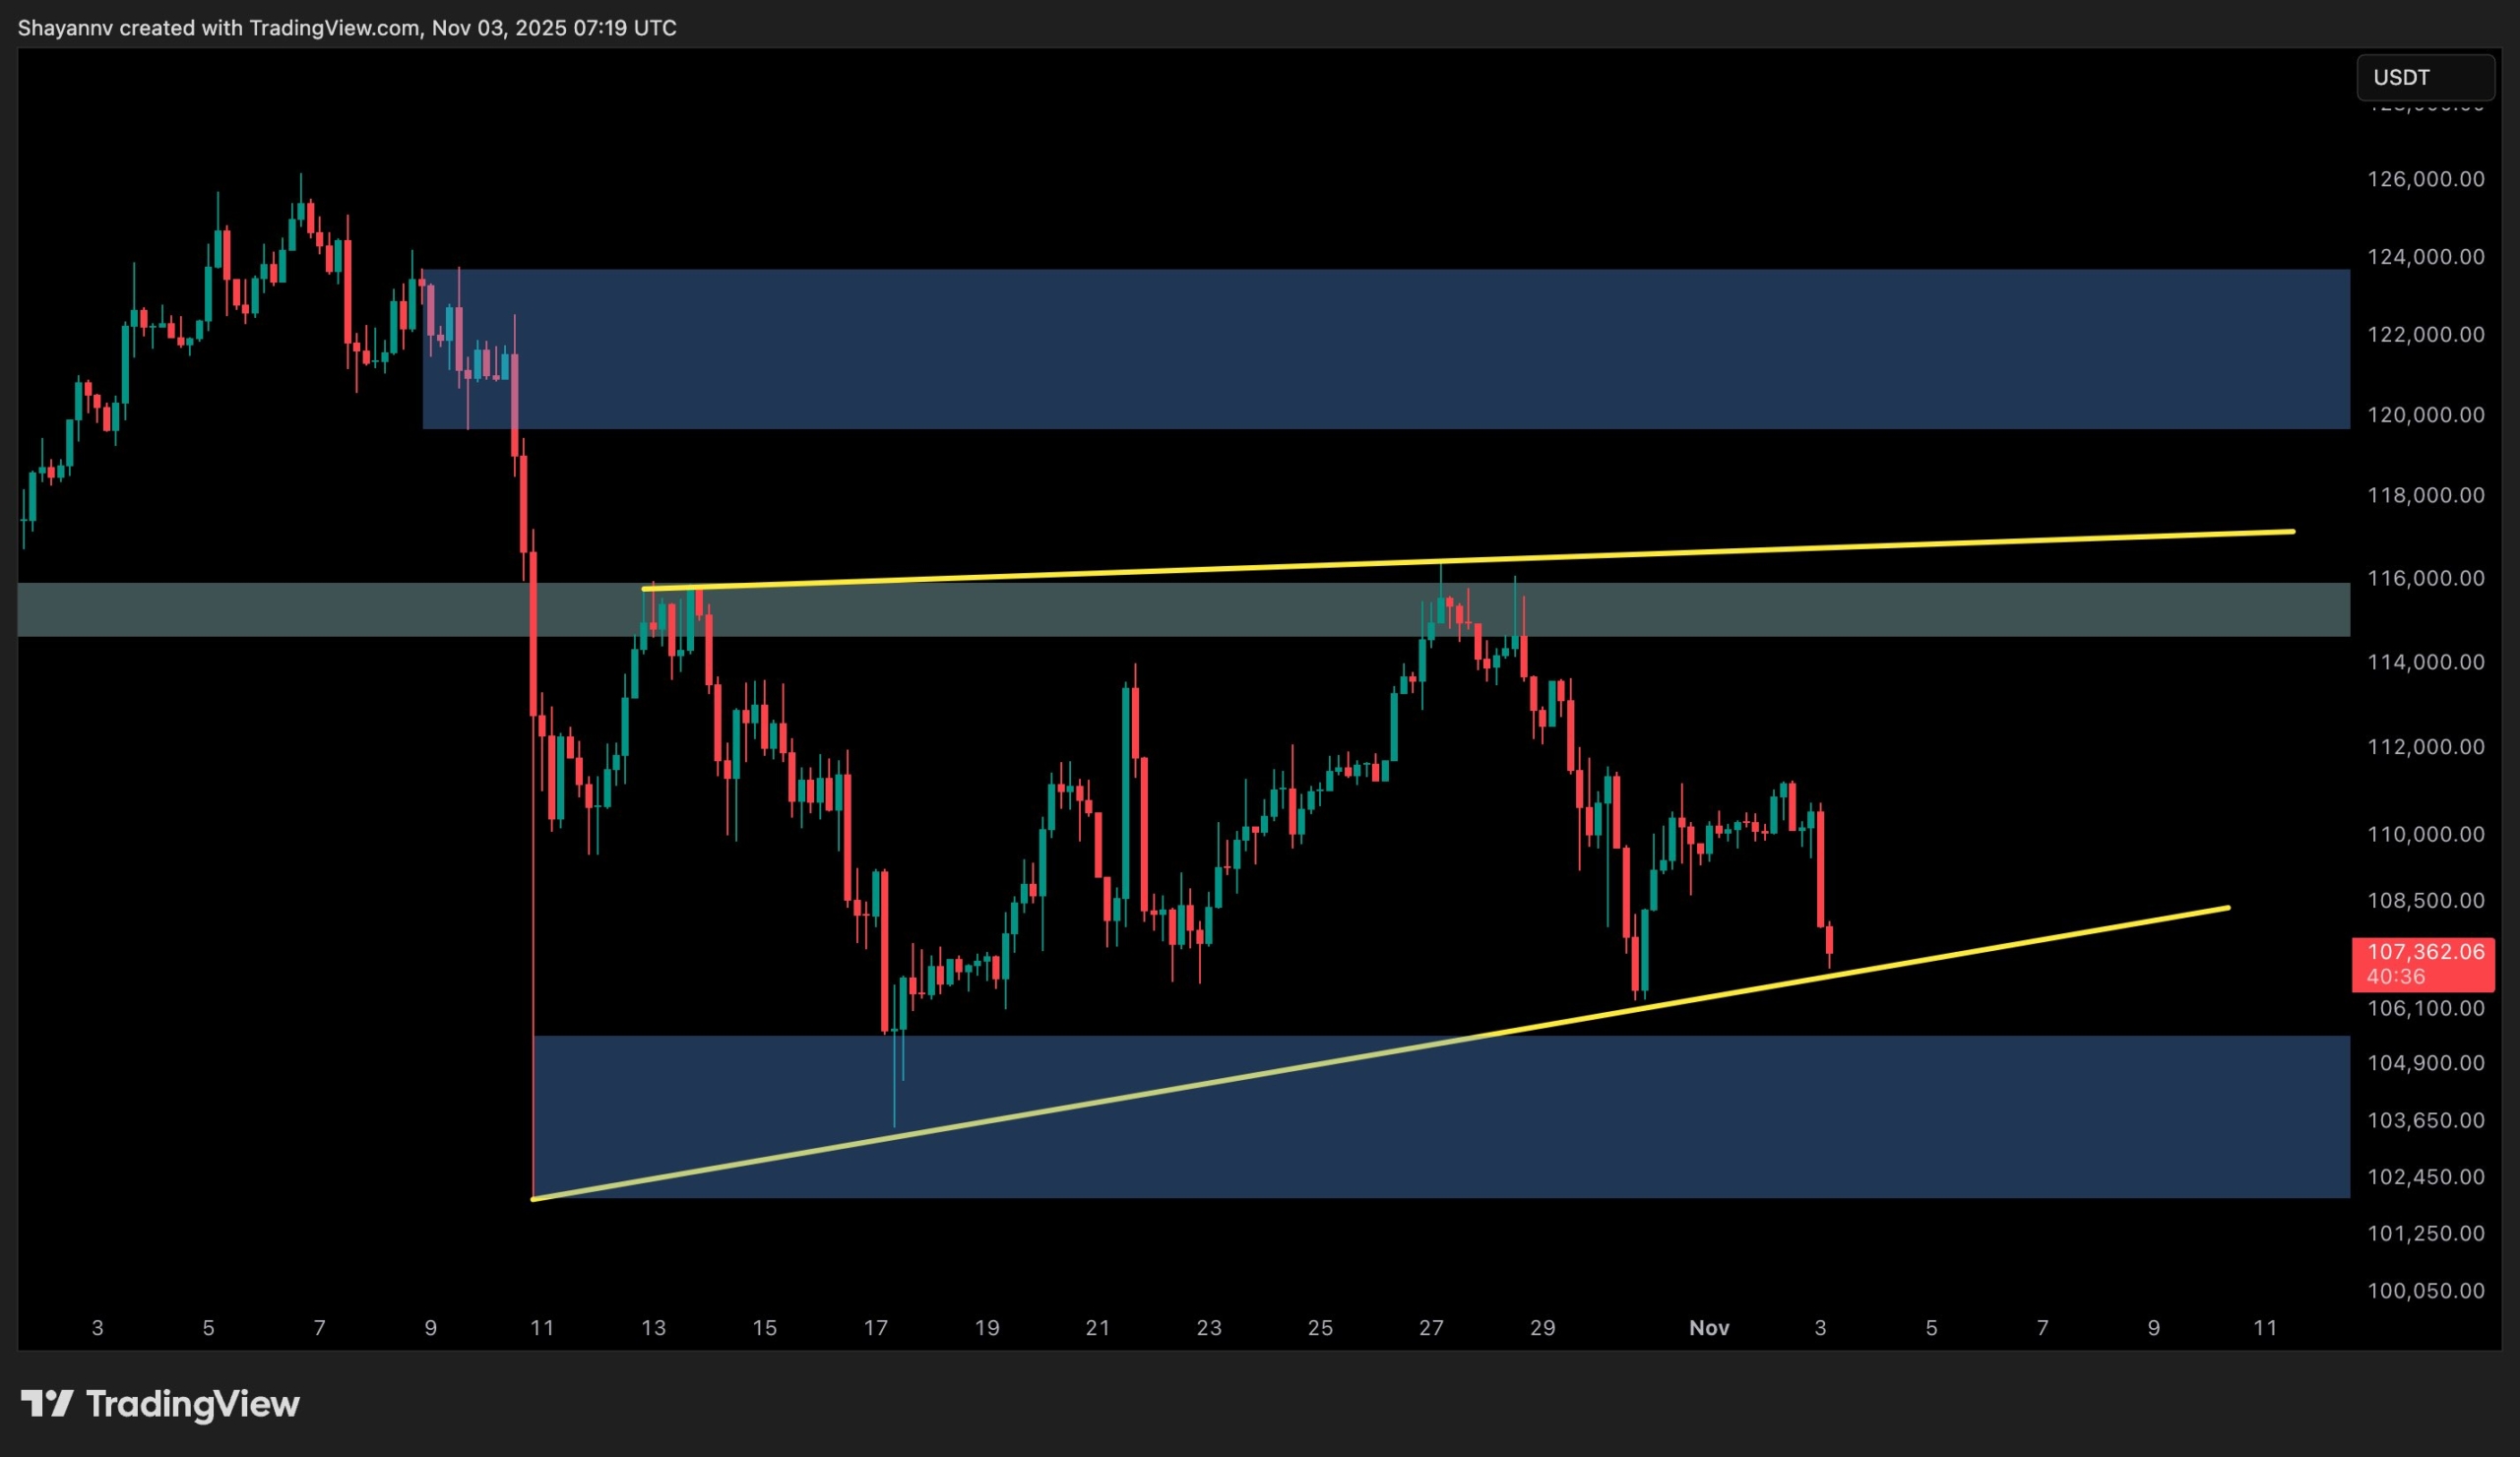
The 4-hour chart highlights the current ascending wedge formation, with BTC retesting the lower trendline near the $106,000 support zone.
This region coincides with the bottom of the larger daily equilibrium range, making it an important area to monitor for a potential rebound. A successful defense of this zone would likely set the stage for another test of the $114,000-$116,000 resistance, but failure to hold could result in a sharper move towards the $102,000 demand area.
Volume and liquidity indicators suggest that buyers remain cautious and wait for clear confirmation before actively resuming trading.
On-chain analysis
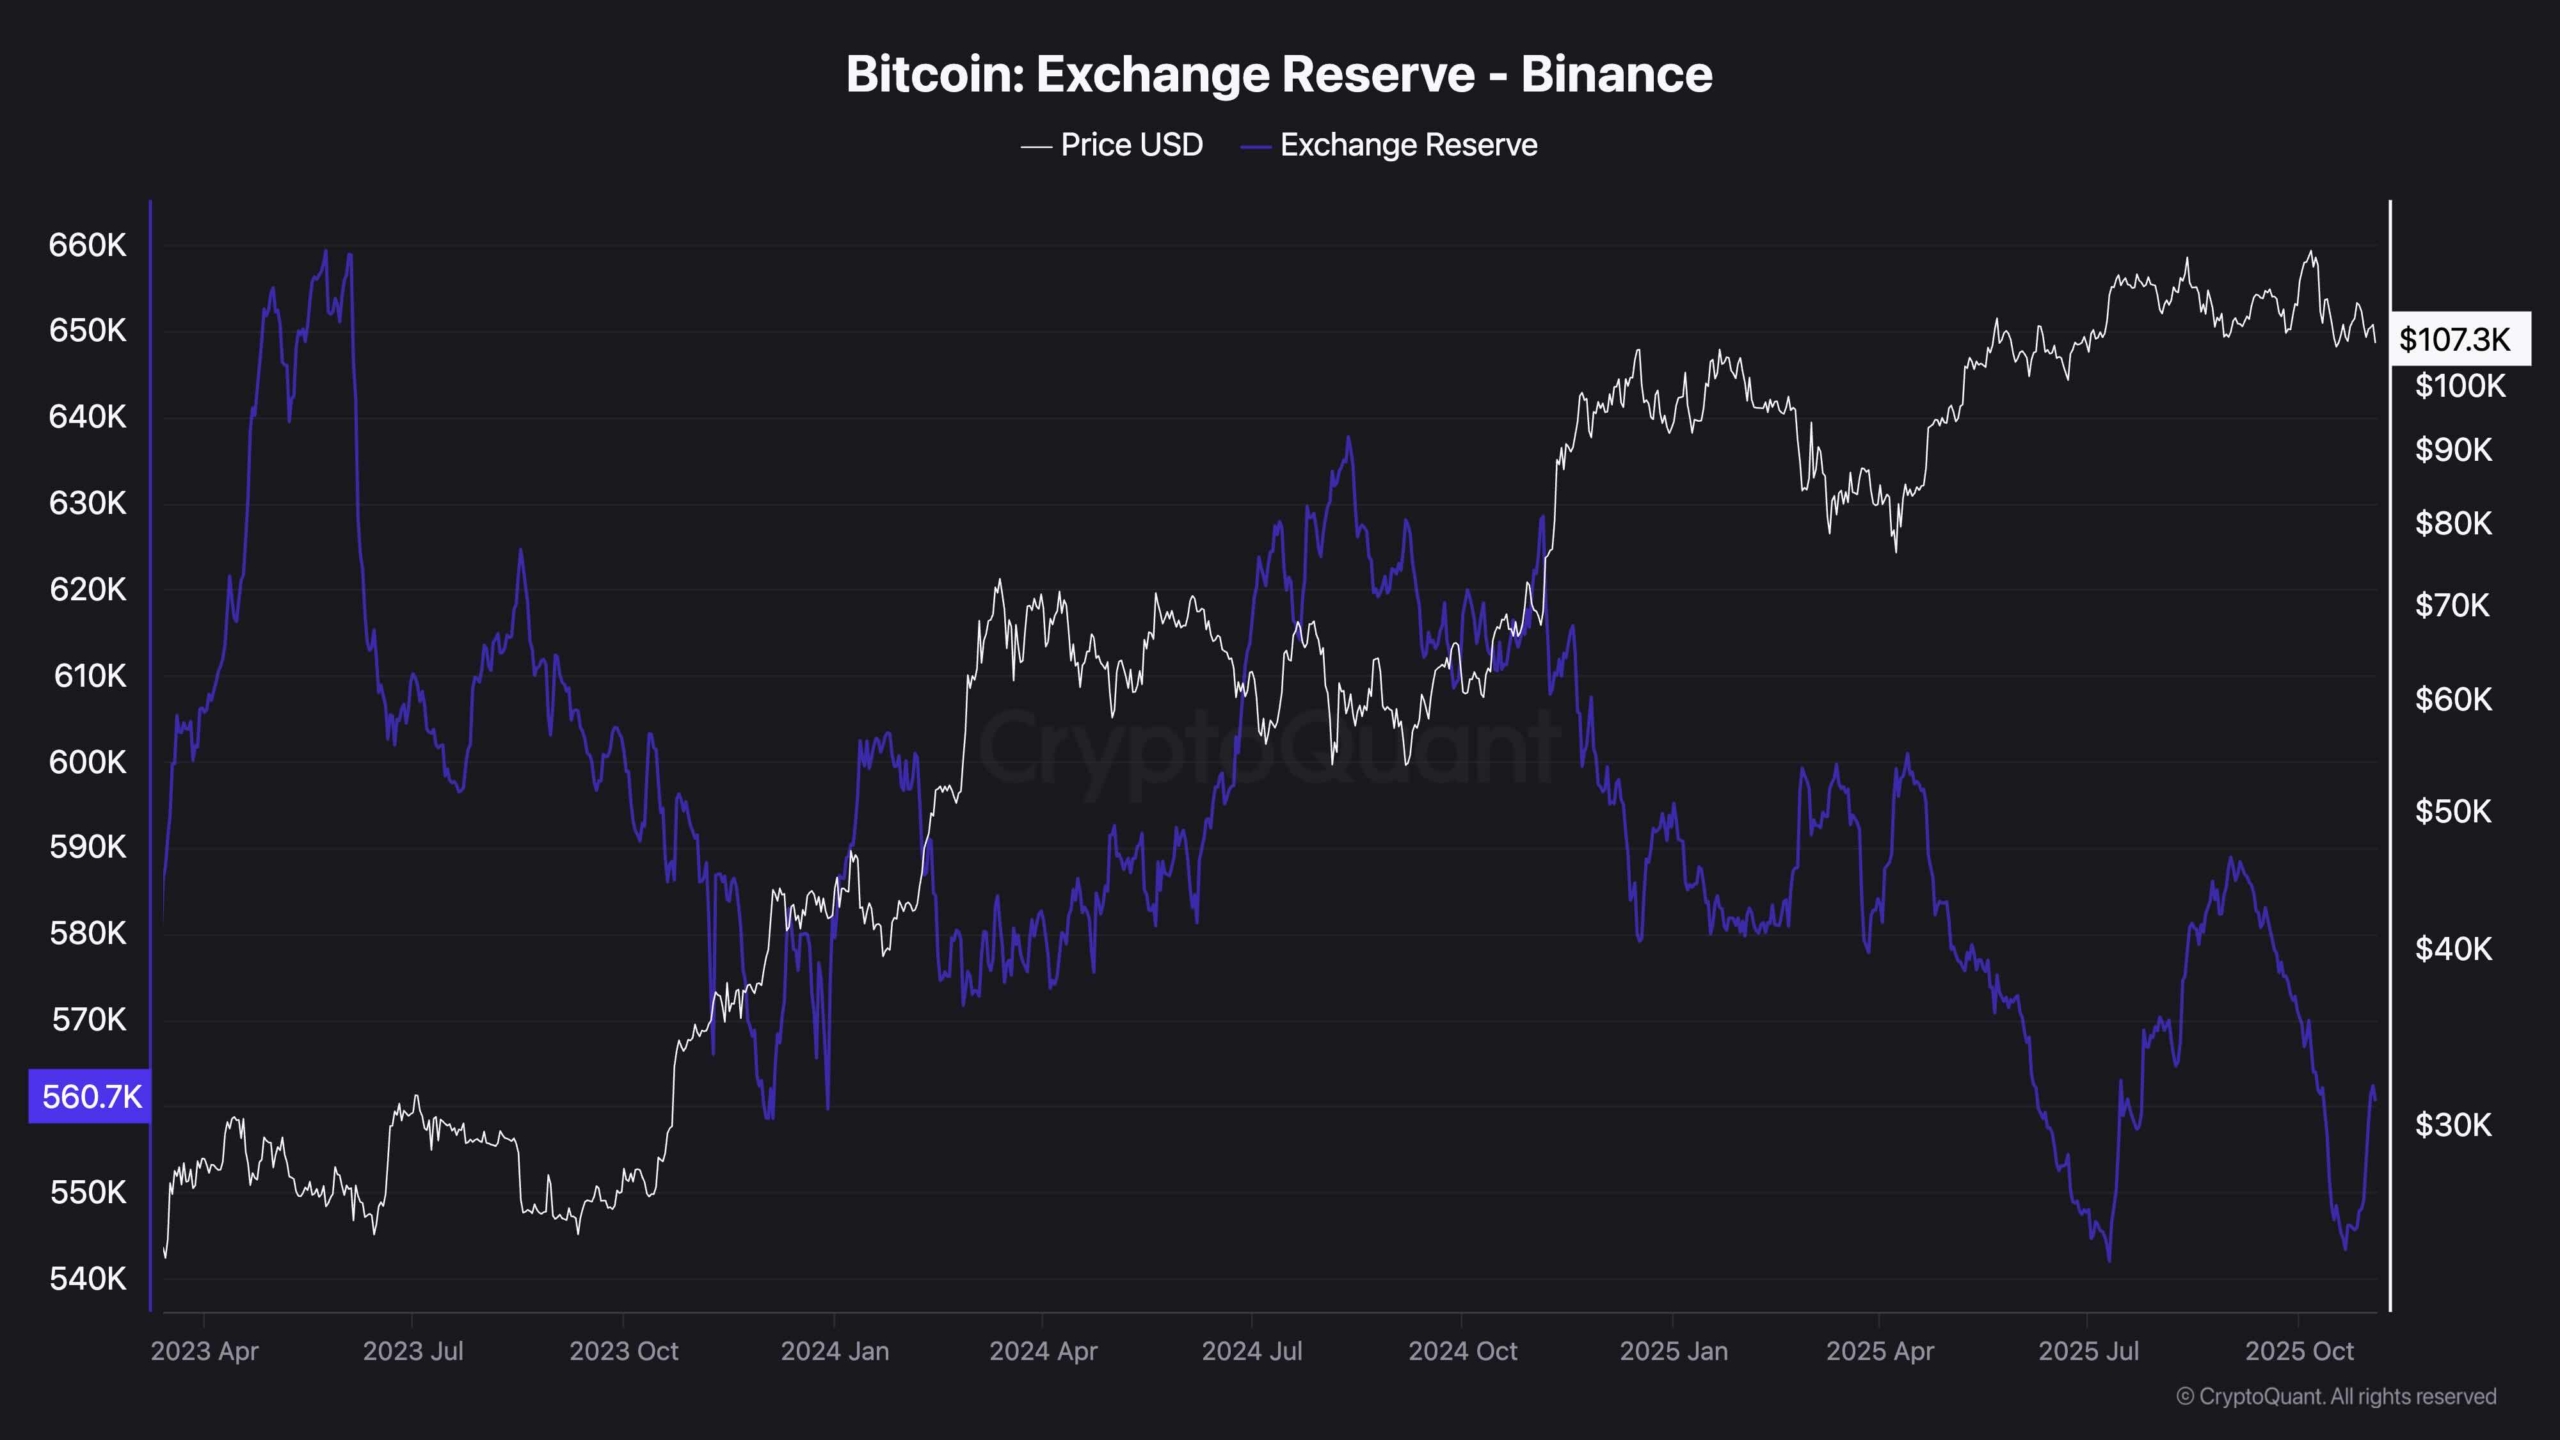
The latest exchange reserve data reveals significant discrepancies between global and regional exchange trends. While the total Bitcoin reserves of all major exchanges continue to decline, indicating long-term accumulation and decreasing selling pressure, Binance's foreign exchange reserves have increased noticeably in recent weeks.
This discrepancy suggests that while broader market participants are moving coins into self-custody (a bullish long-term signal), short-term liquidity is accumulating on Binance, which may represent increased trading activity and hedging by institutional investors.
Historically, such inflows into dominant exchanges during consolidation stages often precede periods of heightened volatility as market makers prepare for the next big move.
If this trend of Binance's reserves growth continues and total foreign exchange reserves decline, it could enter a pre-distribution or rebalancing phase before another accumulation-driven rally begins.