

After a week of tough movement, Bitcoin has hovered around $108,300 as the Bulls continue to test their upper supply zones between $108,800 and $110,400. Price action concludes within a well-defined range of horizontal resistance, but higher lows and bullish market structures suggest that breakouts may be brewed. Traders are closely watching whether Bitcoin prices today can maintain upward momentum mid-week.
What will happen to Bitcoin prices?
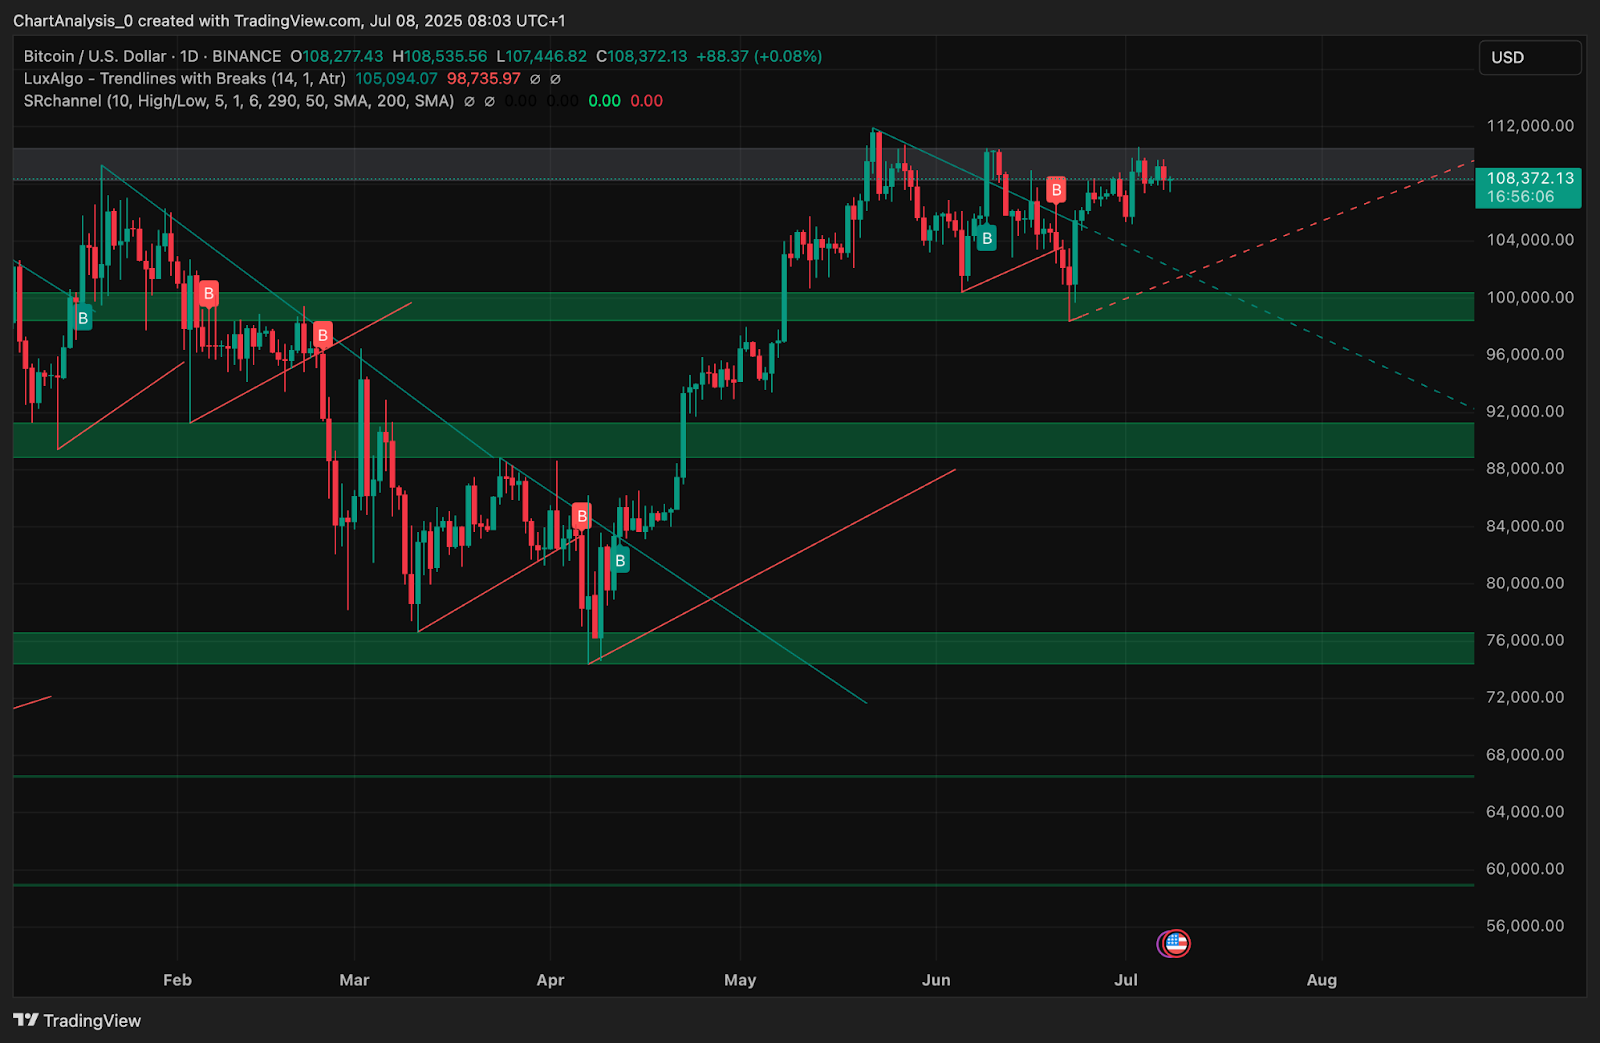
BTC price forecast (source: TradingView)
BTC continues trading between $109,000 and $110,500 within compression ranges under the long-standing resistance band. On the daily charts, this zone has repeatedly rejected prices since early June. Nevertheless, buyers have consistently defended the growing trendline from April lows, but prices are above 20/50/100 EMA.
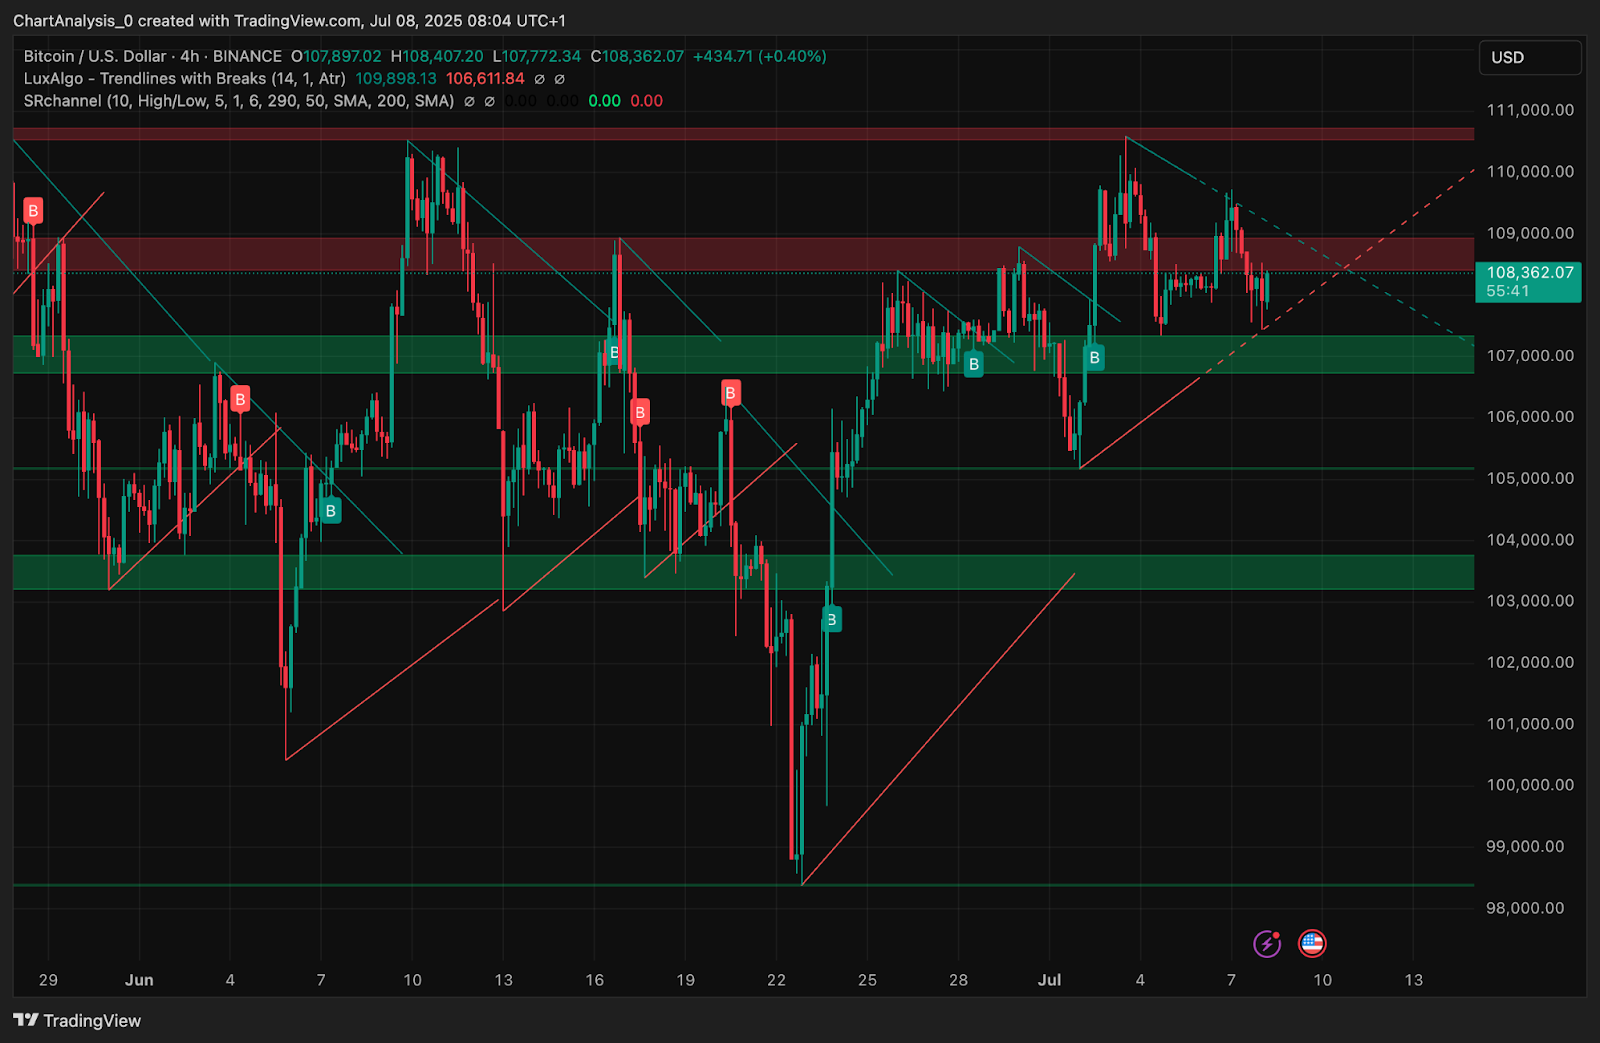
BTC price forecast (source: TradingView)
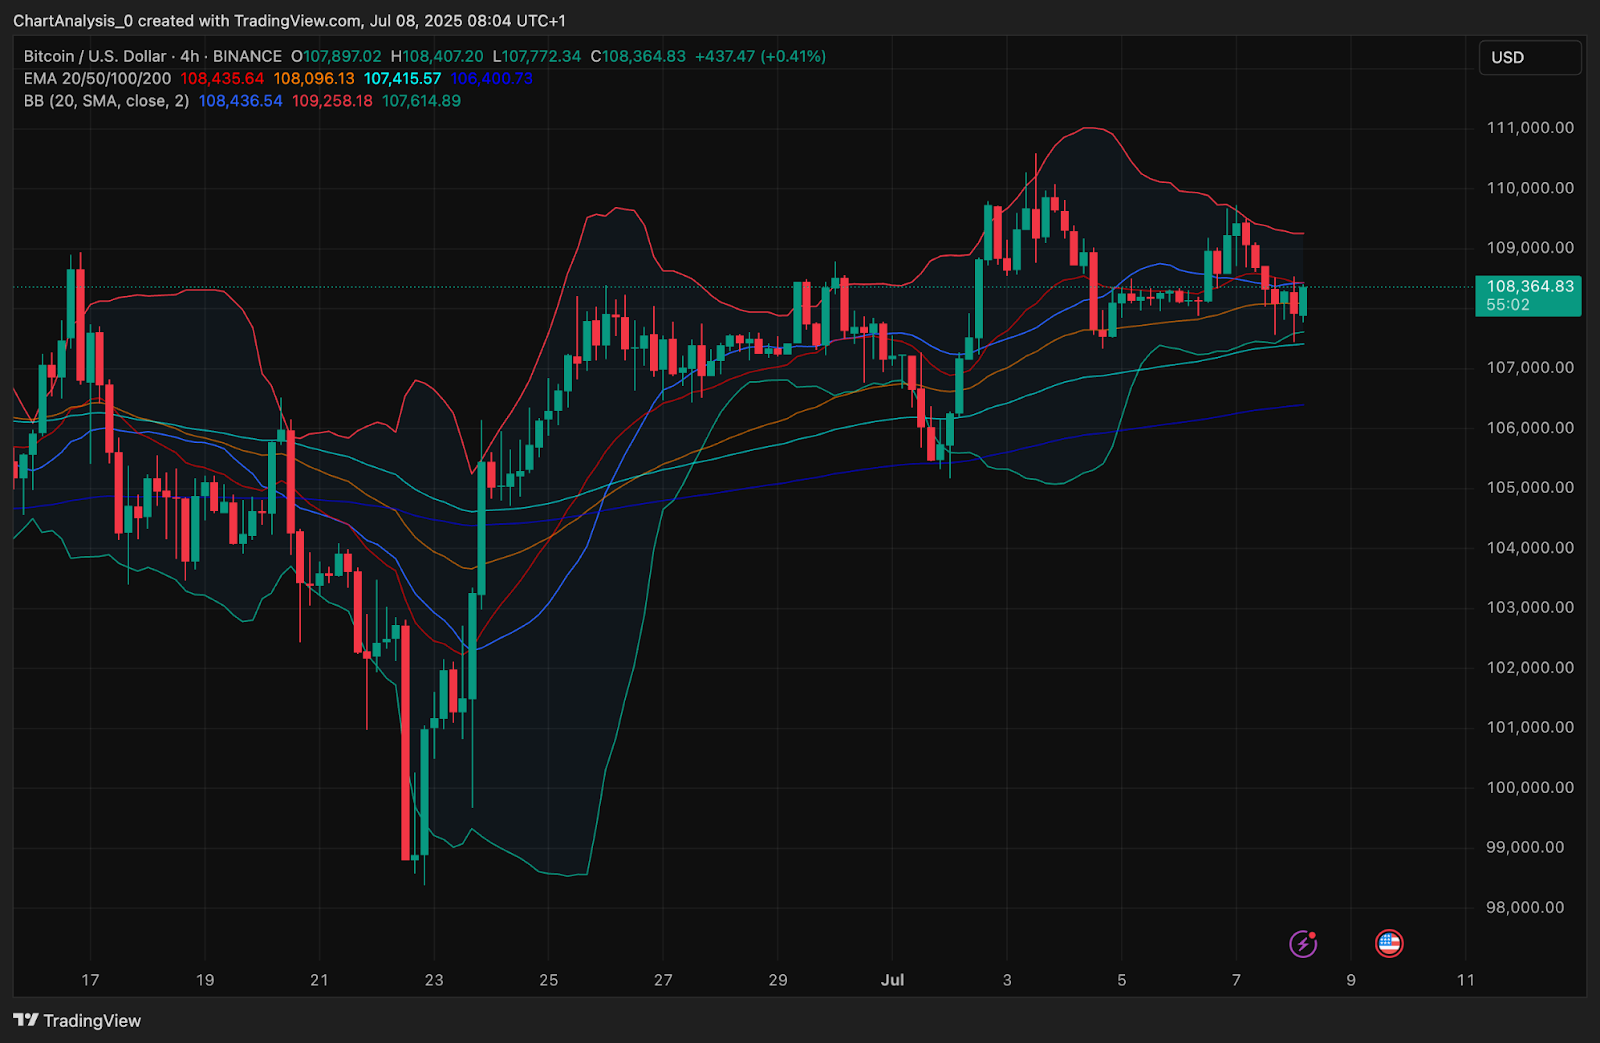
On the four-hour chart, Bitcoin bounced back from the $107,000 demand zone and regained the upward channel that was held since late June. This move coincides with the confluence of bullish order blocks and trendlines, indicating the potential base building structure of another leg.
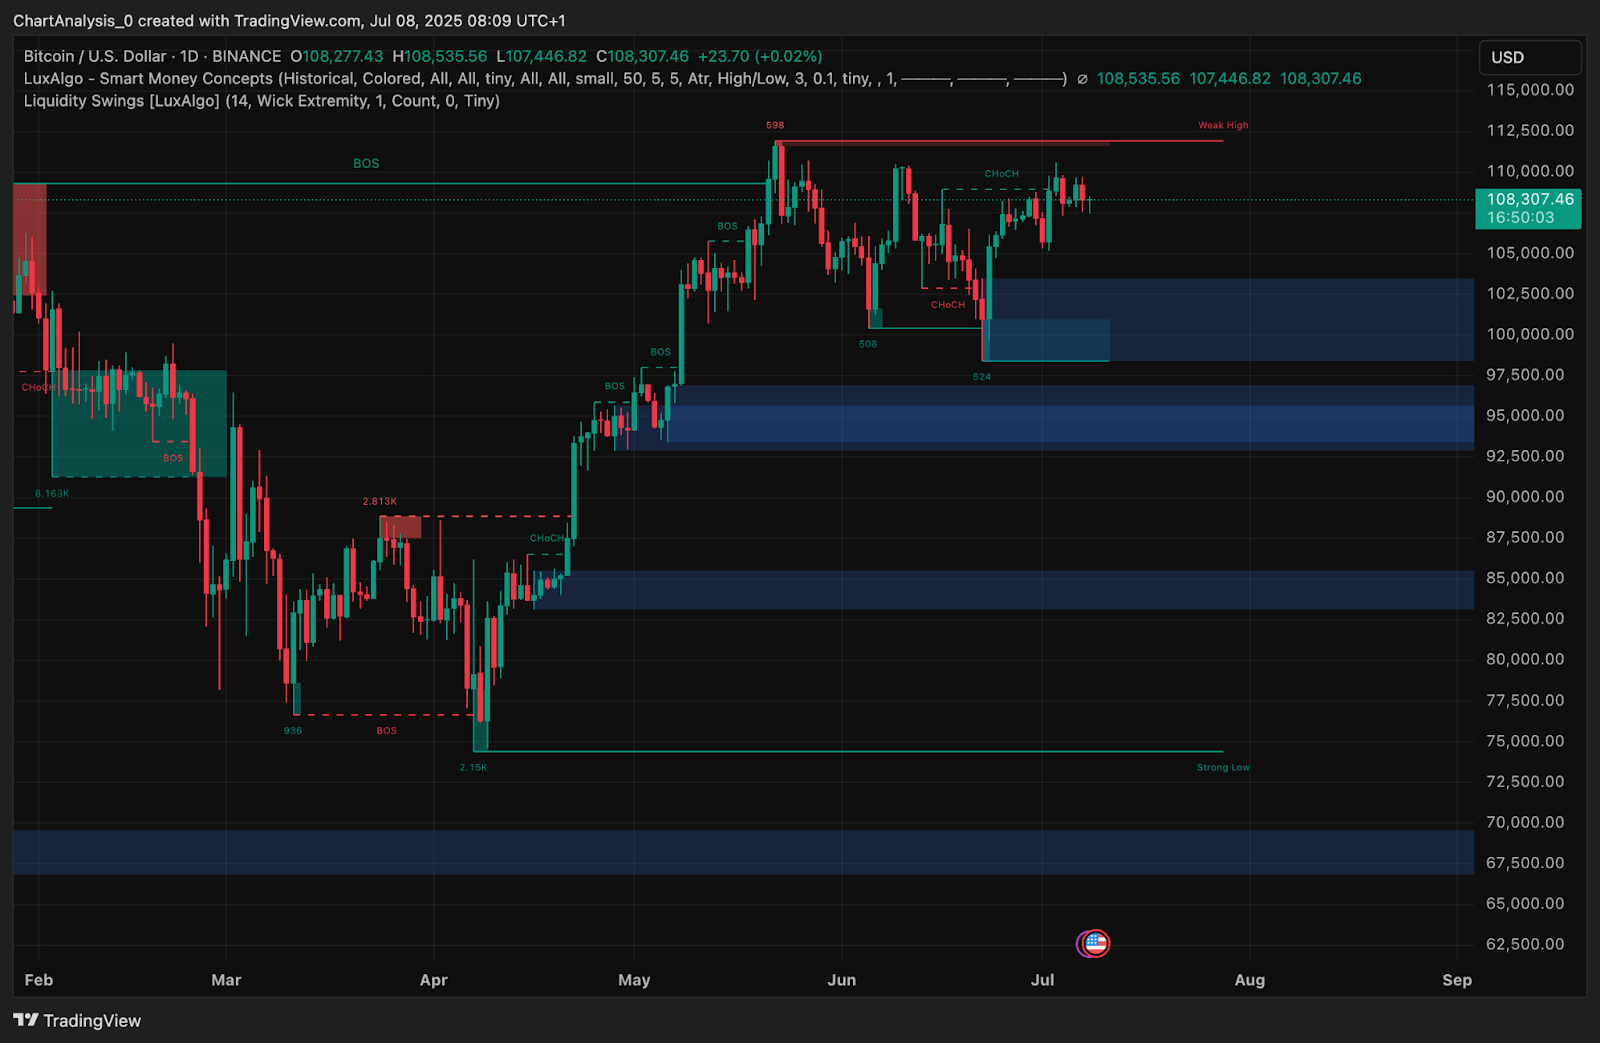
BTC price forecast (source: TradingView)
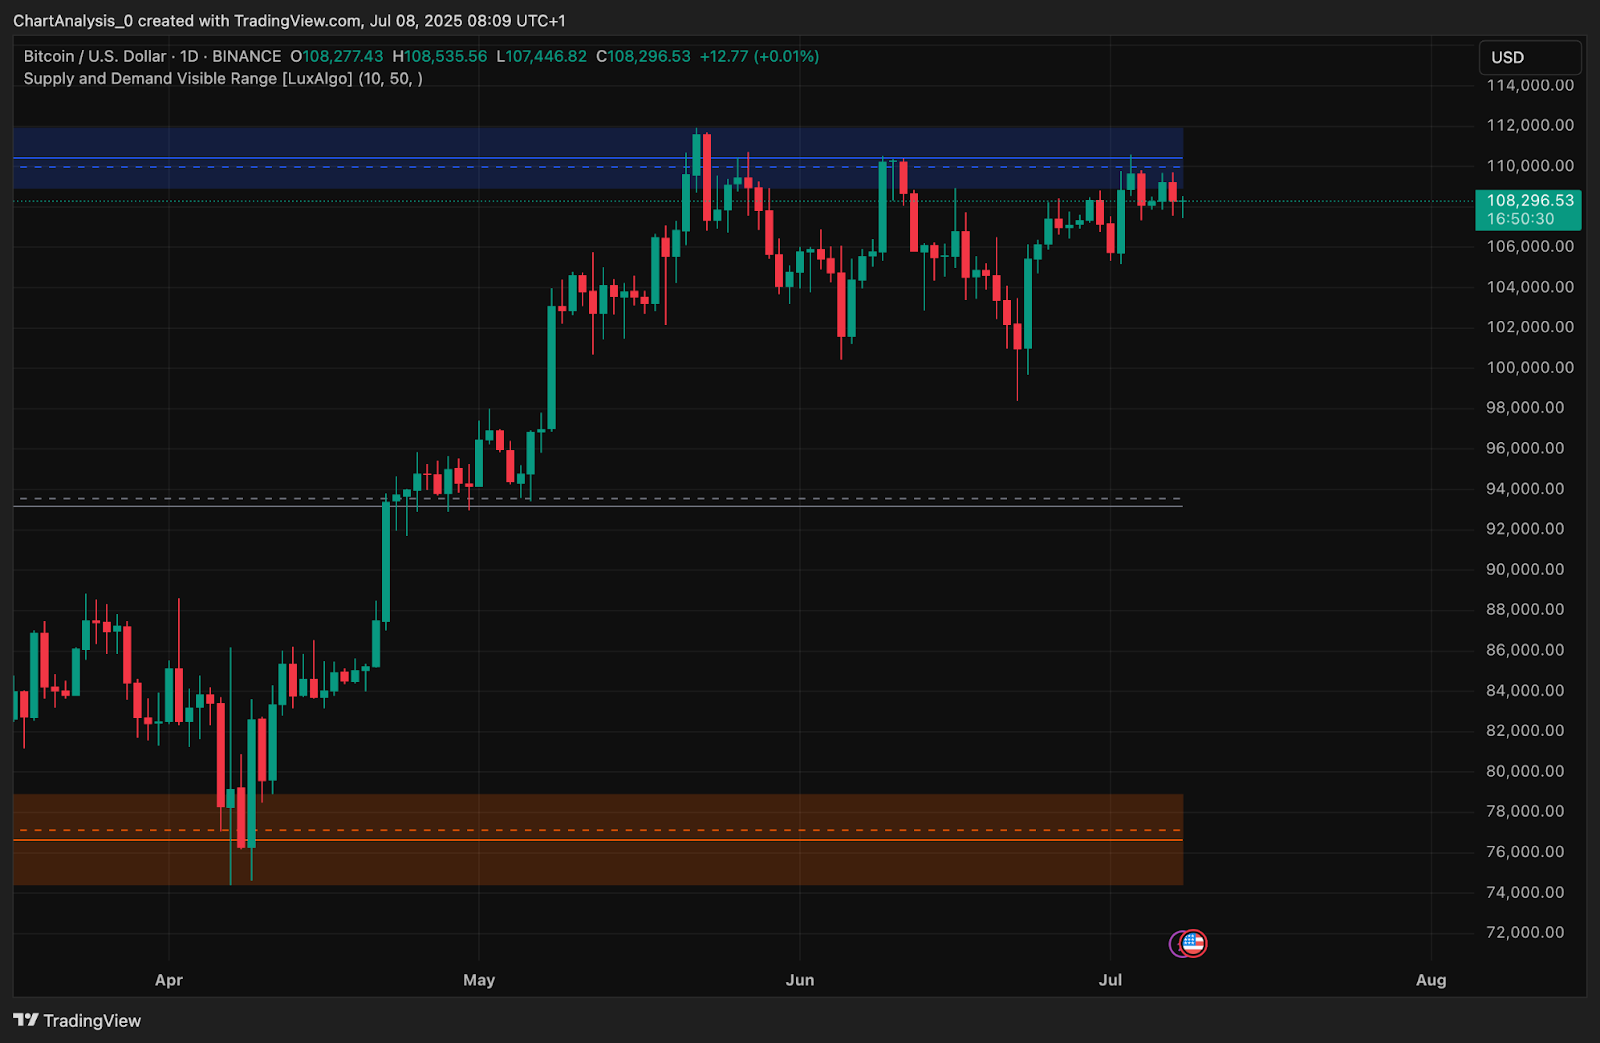
Market structure remains bullish on the higher time frame, with repeated breaks (BOs) of the structure seen on smart money charts. The liquidity remains clustered above $110,000, and if the current range breaks, that level is likely to become a magnet.
Why is Bitcoin prices rising today?
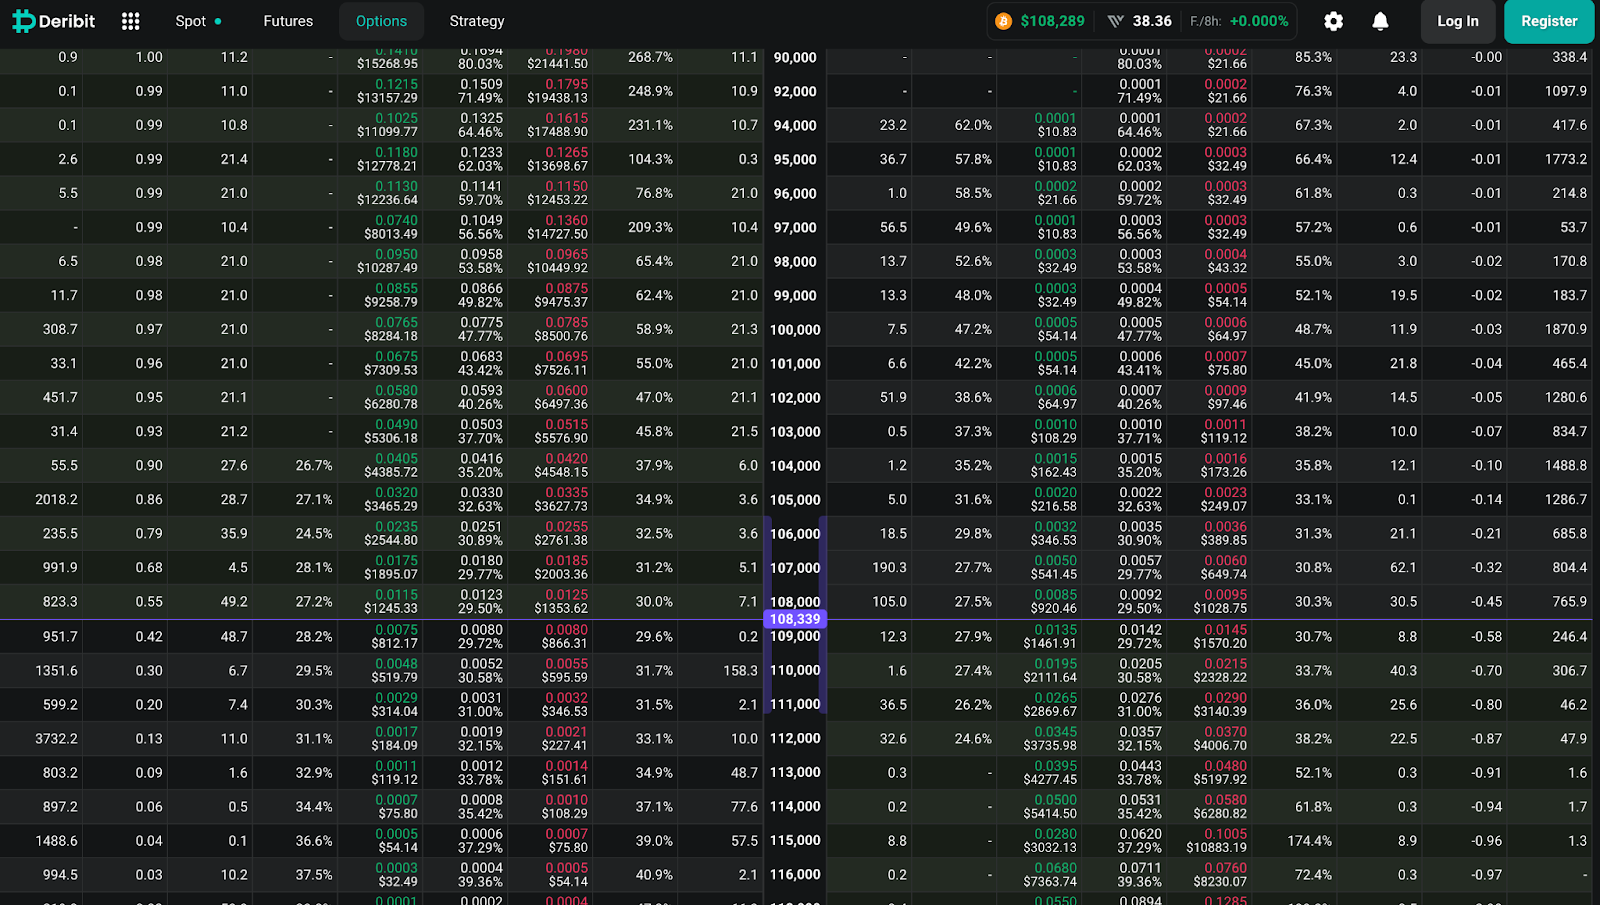
BTC Option Chain Data Expiration Date July 11th (Source: DELIBIT)
The question of why Bitcoin prices are rising today finds the answer in both price structure and derivative data. Deribit's BTC options data shows big calls interest between $110,000 and $112,000, with a prominent open interest of $110,000. This suggests that speculative bets continue to support breakouts beyond the immediate resistance band.
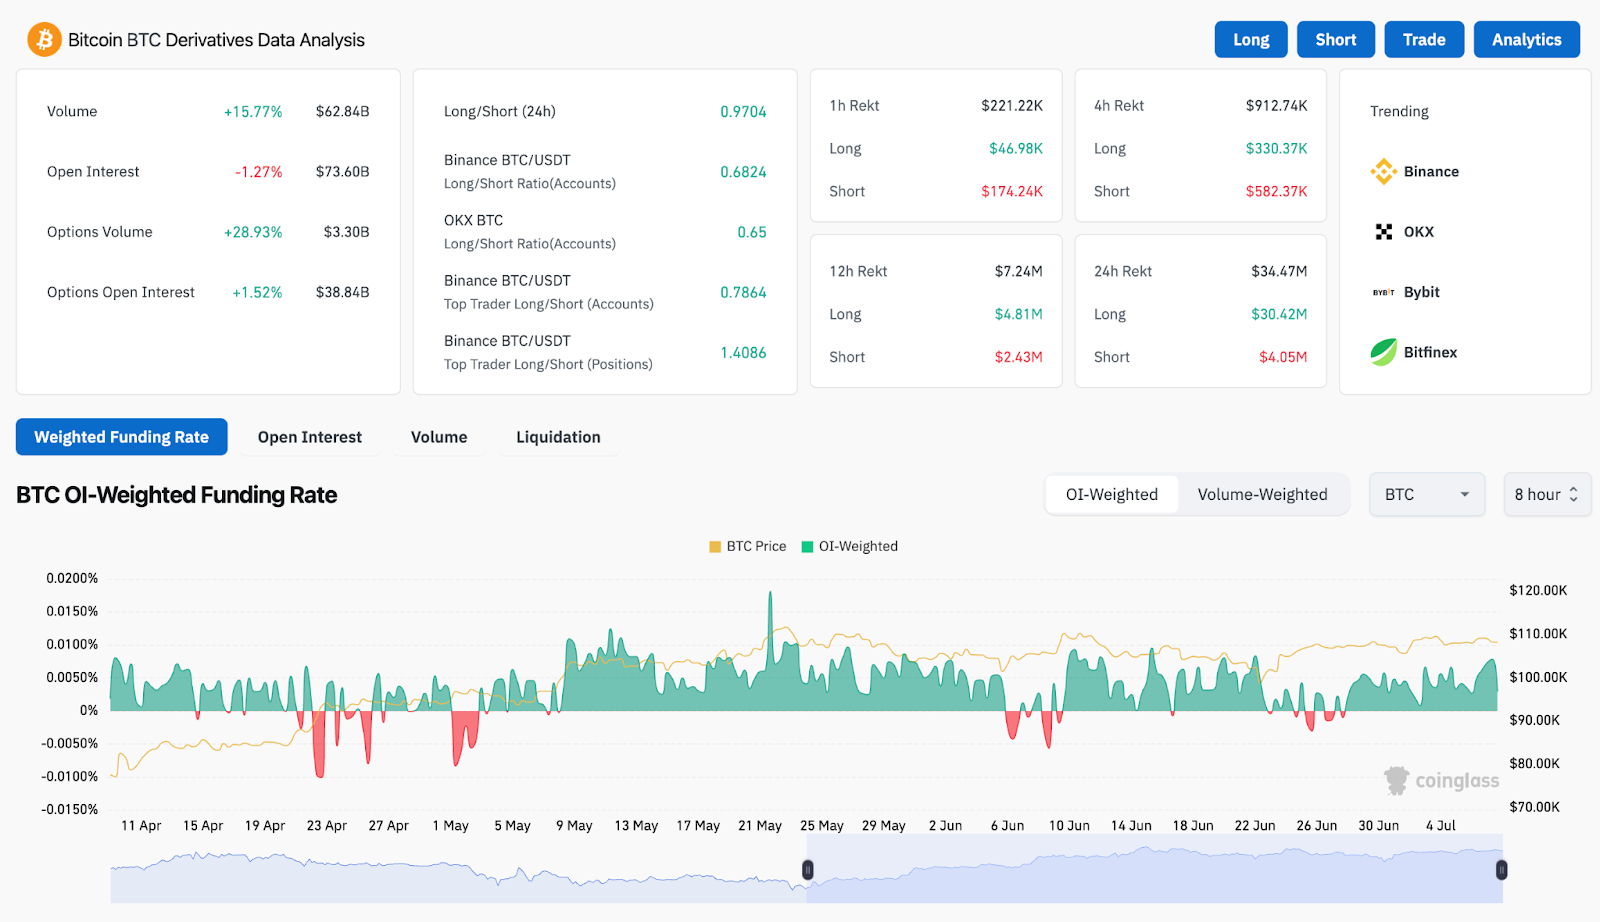
BTC Derivative Analysis (Source: Coinglass)
The funding rate is positive, but moderate, indicating controlled bullish sentiment. The amount of derivatives has increased by 15.7% over the last 24 hours, with the optional volume jumping by nearly 29%. The long/short ratios of Binance and OKX overall remain near neutral, suggesting that current movements are not over-utilized.
Meanwhile, the 4-hour chart bollinger band is tightened again, hinting at another volatility extension cycle. Currently, the price is pushing the midband, which is close to $108,300, and pushing the upper band through at $109,250 could rekindle the bullish continuation.
Bitcoin indicators indicate possible coiled breakouts
BTC price forecast (source: TradingView)
Technology supports breakout scenarios as momentum resets just below resistance. In the 4-hour time frame, Bitcoin price action shows stable grinding above 100 EMA ($107,415) and 200 EMA ($106,400). The Short Term 20/50 EMA offers immediate support around $108,000-$108,400, creating bullish clusters.
The Bollinger band is narrower and shows a decrease in volatility, a classic precursor to impulsive movement. The RSI is neutral at 52, leaving even more upside down without informing the terms of the acquisition. The MACD is slightly positive, but remains flat, reflecting temporal equilibrium.
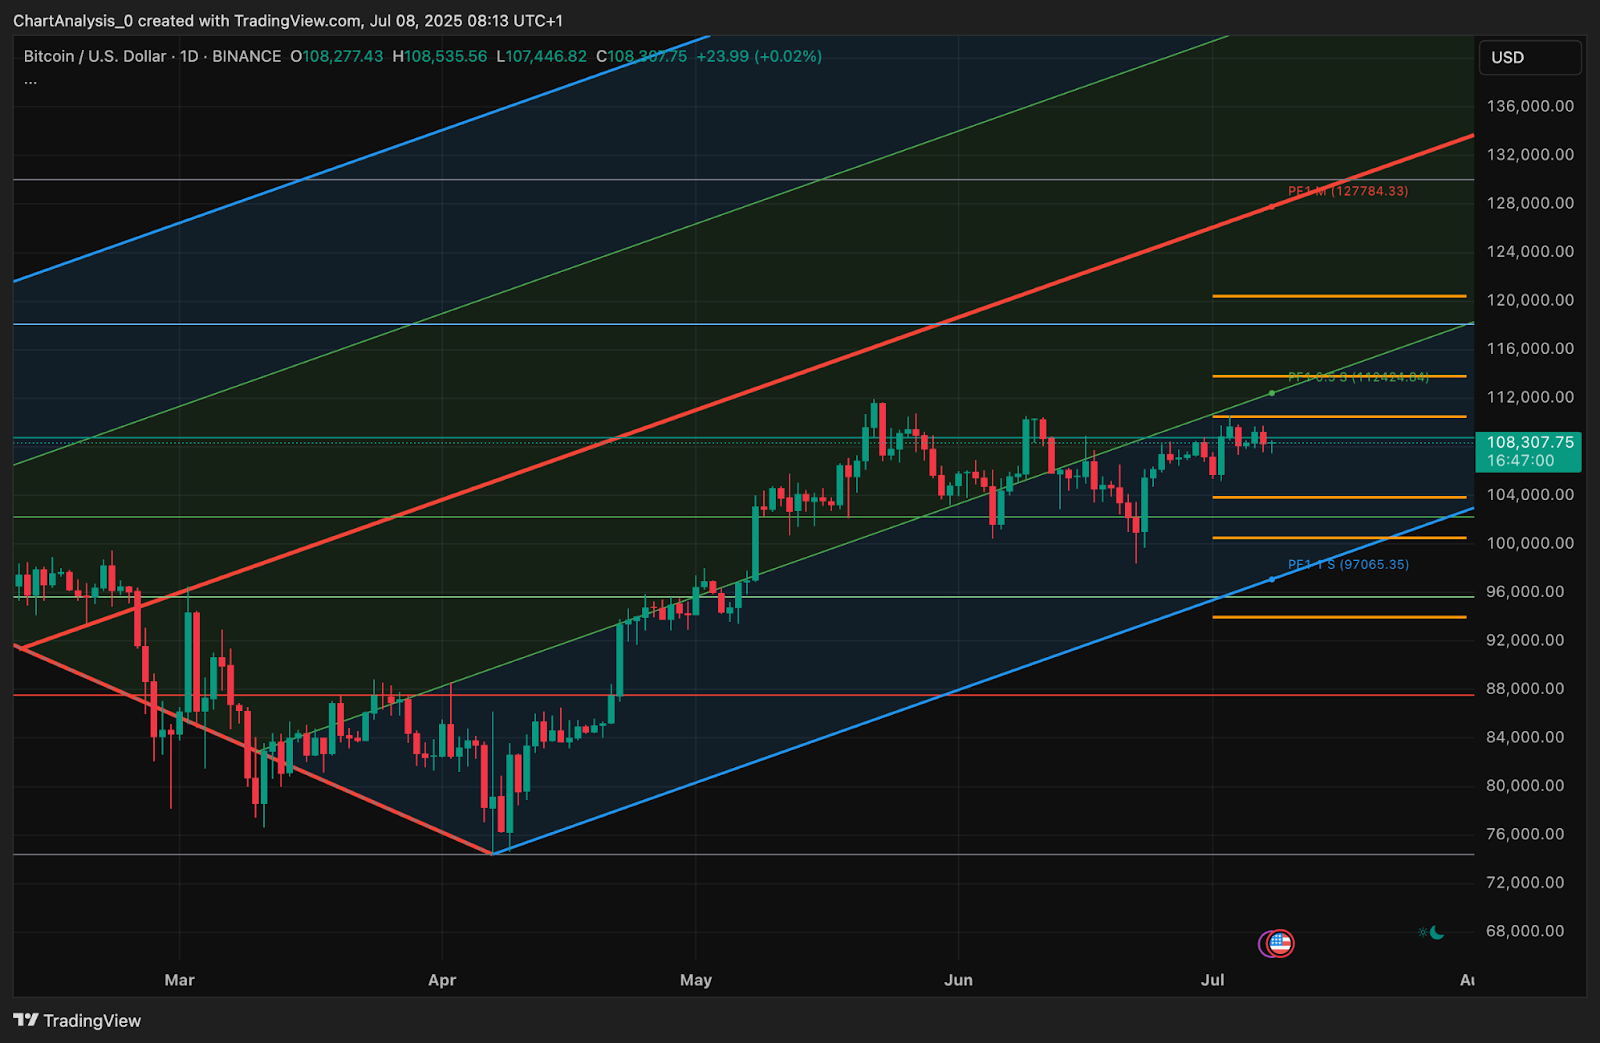
From a wider structural view, BTC is still trading within the larger upward channel, extending from March, with current levels representing midrange equilibrium. A clean break over $110,500 could send a price to a channel top that is close to $114,000, but if you can't hold $107,000, you'll end up risking your slides in a support pocket between $104,500 and $105,200.
BTC price forecast: Short-term outlook (24 hours)
BTC price forecast (source: TradingView)
On July 9th, Bitcoin prices could continue to vibrate within the $107,000-$110,500 band unless the volume rises decisively. If the Bulls are able to close four-hour candles over $109,250 with confirmation, the next target will be $111,200, followed by a $114,000 channel top.
However, if you don't keep up with $107,000, you'll be triggered a revisit of previous range support, close to $105,400. Below that, the strong demand zone of around $103,000 could serve as a line of defense.
In the options market, bullish bias is increasing above $108,000, with clear interest construction being a strike of $110,000 and $112,000. Traders should be aware of the potential invalidation of volume breakouts and symmetric range formation from June onwards.
Bitcoin Price Prediction Table: July 9, 2025
Disclaimer: The information contained in this article is for information and educational purposes only. This article does not constitute any kind of financial advice or advice. Coin Edition is not liable for any losses that arise as a result of your use of the content, products or services mentioned. We encourage readers to take caution before taking any actions related to the company.