

After briefly regaining $94,000 the previous day, Bitcoin fell to the $91,000 zone on Tuesday.
The latest data showed strong selling pressure near key resistance levels despite improving underlying demand indicators.
A large number of sell orders capped Bitcoin’s bull run near $95,000.
The pullback was due to a failed attempt to break out of the $94,000 to $95,000 range, with order book data revealing nearly $100 million in sell orders across major exchanges.
This concentration of liquidity acted as a ceiling, halting the rally and causing short-term profit-taking.
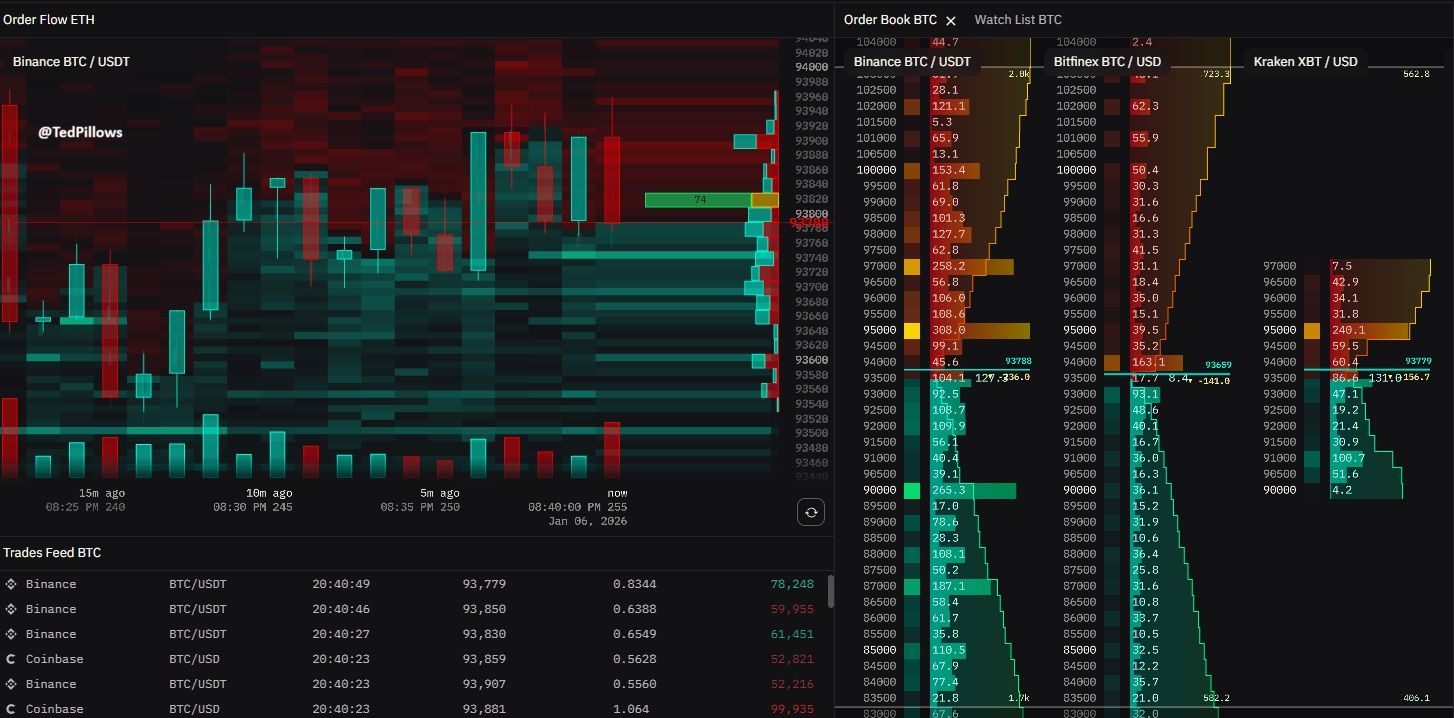
Large sell order between $94,000 and $95,000 zone
Bitcoin’s $91,000 zone is the entry point for a large number of new buyers entering the market in early 2025. These buyers appear to be locking in short profits today following the recent volatility.
The order book heatmap showed that sellers were absorbing buying pressure as Bitcoin entered the zone.
Once the upward momentum stalled, leveraged traders exited their positions, accelerating the decline towards $91,000. This move reflected market structure rather than a sudden change in sentiment.
Most of the short-term downside liquidity has disappeared.
One more flush towards the $90,500-$90,800 levels, likely before a reversal. pic.twitter.com/FnWjP2FpuP
— Ted (@TedPillows) January 6, 2026
Price reversal is still in the plan
Despite the pullback, on-chain and flow data suggests broader trends remain constructive.
According to data from CryptoQuant, the reserve ratio for Bitcoin and stablecoins on Binance has started to rise again, indicating that the purchasing power of onlookers is increasing.
Binance’s Bitcoin/Stablecoin Ratio Suggests Rising Purchasing Power
“This ratio is starting to rise again. This change could signal the early stages of a gradual rollout of liquidity, which would be a very positive signal for the market. – By @Darkfost_Coc pic.twitter.com/eIuQeekNEt
— CryptoQuant.com (@cryptoquant_com) January 6, 2026
A high ratio indicates that traders are holding stablecoins, waiting for favorable entry points, and typically deploying capital during pullbacks rather than chasing breakouts.
This gradual accumulation of liquidity often precedes a consolidation phase in which prices fluctuate within a range before moving in another direction. It typically does not support sharp vertical increases in the short term.
Demand from institutional investors also remains. The Spot Bitcoin ETF recorded net inflows of approximately $697 million on January 5, bringing total inflows to nearly $58 billion.
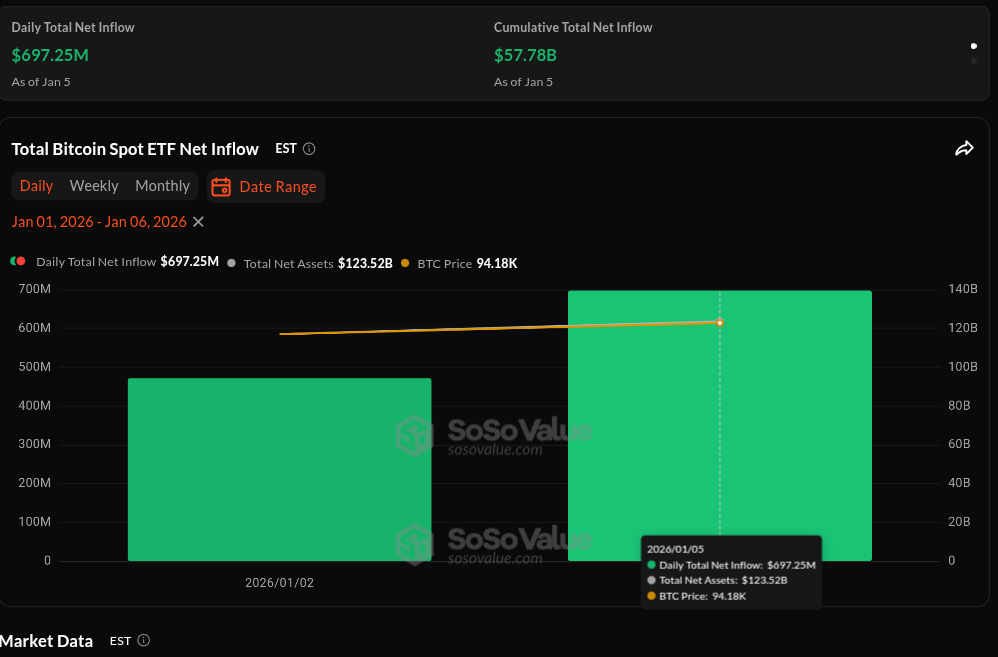
Bitcoin ETF daily inflows. Source: SoSoValue
Importantly, these inflows continued while Bitcoin struggled near resistance, suggesting long-term positioning rather than speculative momentum driving demand.
The contrast between strong ETF inflows and short-term price declines highlights a widening chasm in the market.
Long-term buyers continue to add while short-term traders react to technical levels and liquidity clusters. This dynamic explains why Bitcoin was unable to sustain a rally above $94,000 without triggering widespread panic selling.
There were no signs of large currency inflows or active distribution by long-term holders as a result of the depreciation.
So far, the data points to consolidation rather than reversal. Clearing the $95,000 level will likely require sustained spot demand, reduced sell-side liquidity, and follow-through across risk markets.
Until then, the decline to the low $90,000s appears to be consistent with the market digesting recent gains.
The article “Bitcoin hits $100 million sell wall as new buyers take profits” appeared first on BeInCrypto.