
Bitcoin's $BTC$78,621.47 Last week's 11% drop may be the least of investors' concerns. It should be noted that the price is around $58,000, which is an additional 25% below current levels.
The biggest cryptocurrency's recent sell-off, its biggest weekly decline since March 2025, and its inability to attract buyers has many holders worried about another so-called crypto winter, but it still has a tough road ahead before reaching the silver lining of the 200-week moving average (WMA).
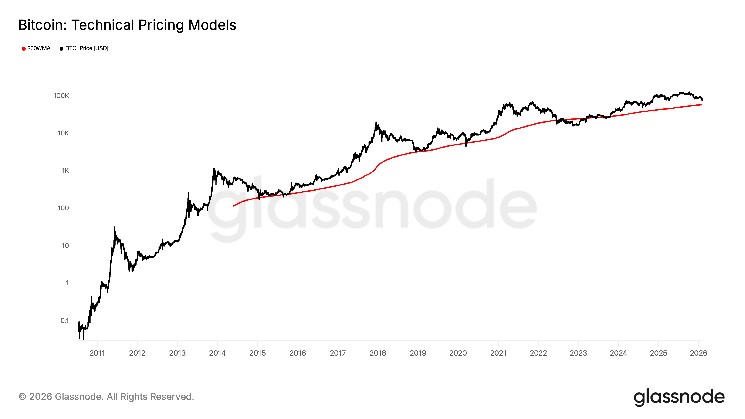
average closing price $BTC The past 200 weeks of data is a widely used long-term momentum indicator and the baseline for the traditional four-year Bitcoin cycle. It has marked the market bottom every cycle so far and is currently at $57,926.
Historically, Bitcoin has often peaked in the fourth quarter of fourth cycle years. This time, it hit a record high of $126,000 in October, but is now down about 40% from that peak.
More slides may be on the cards.
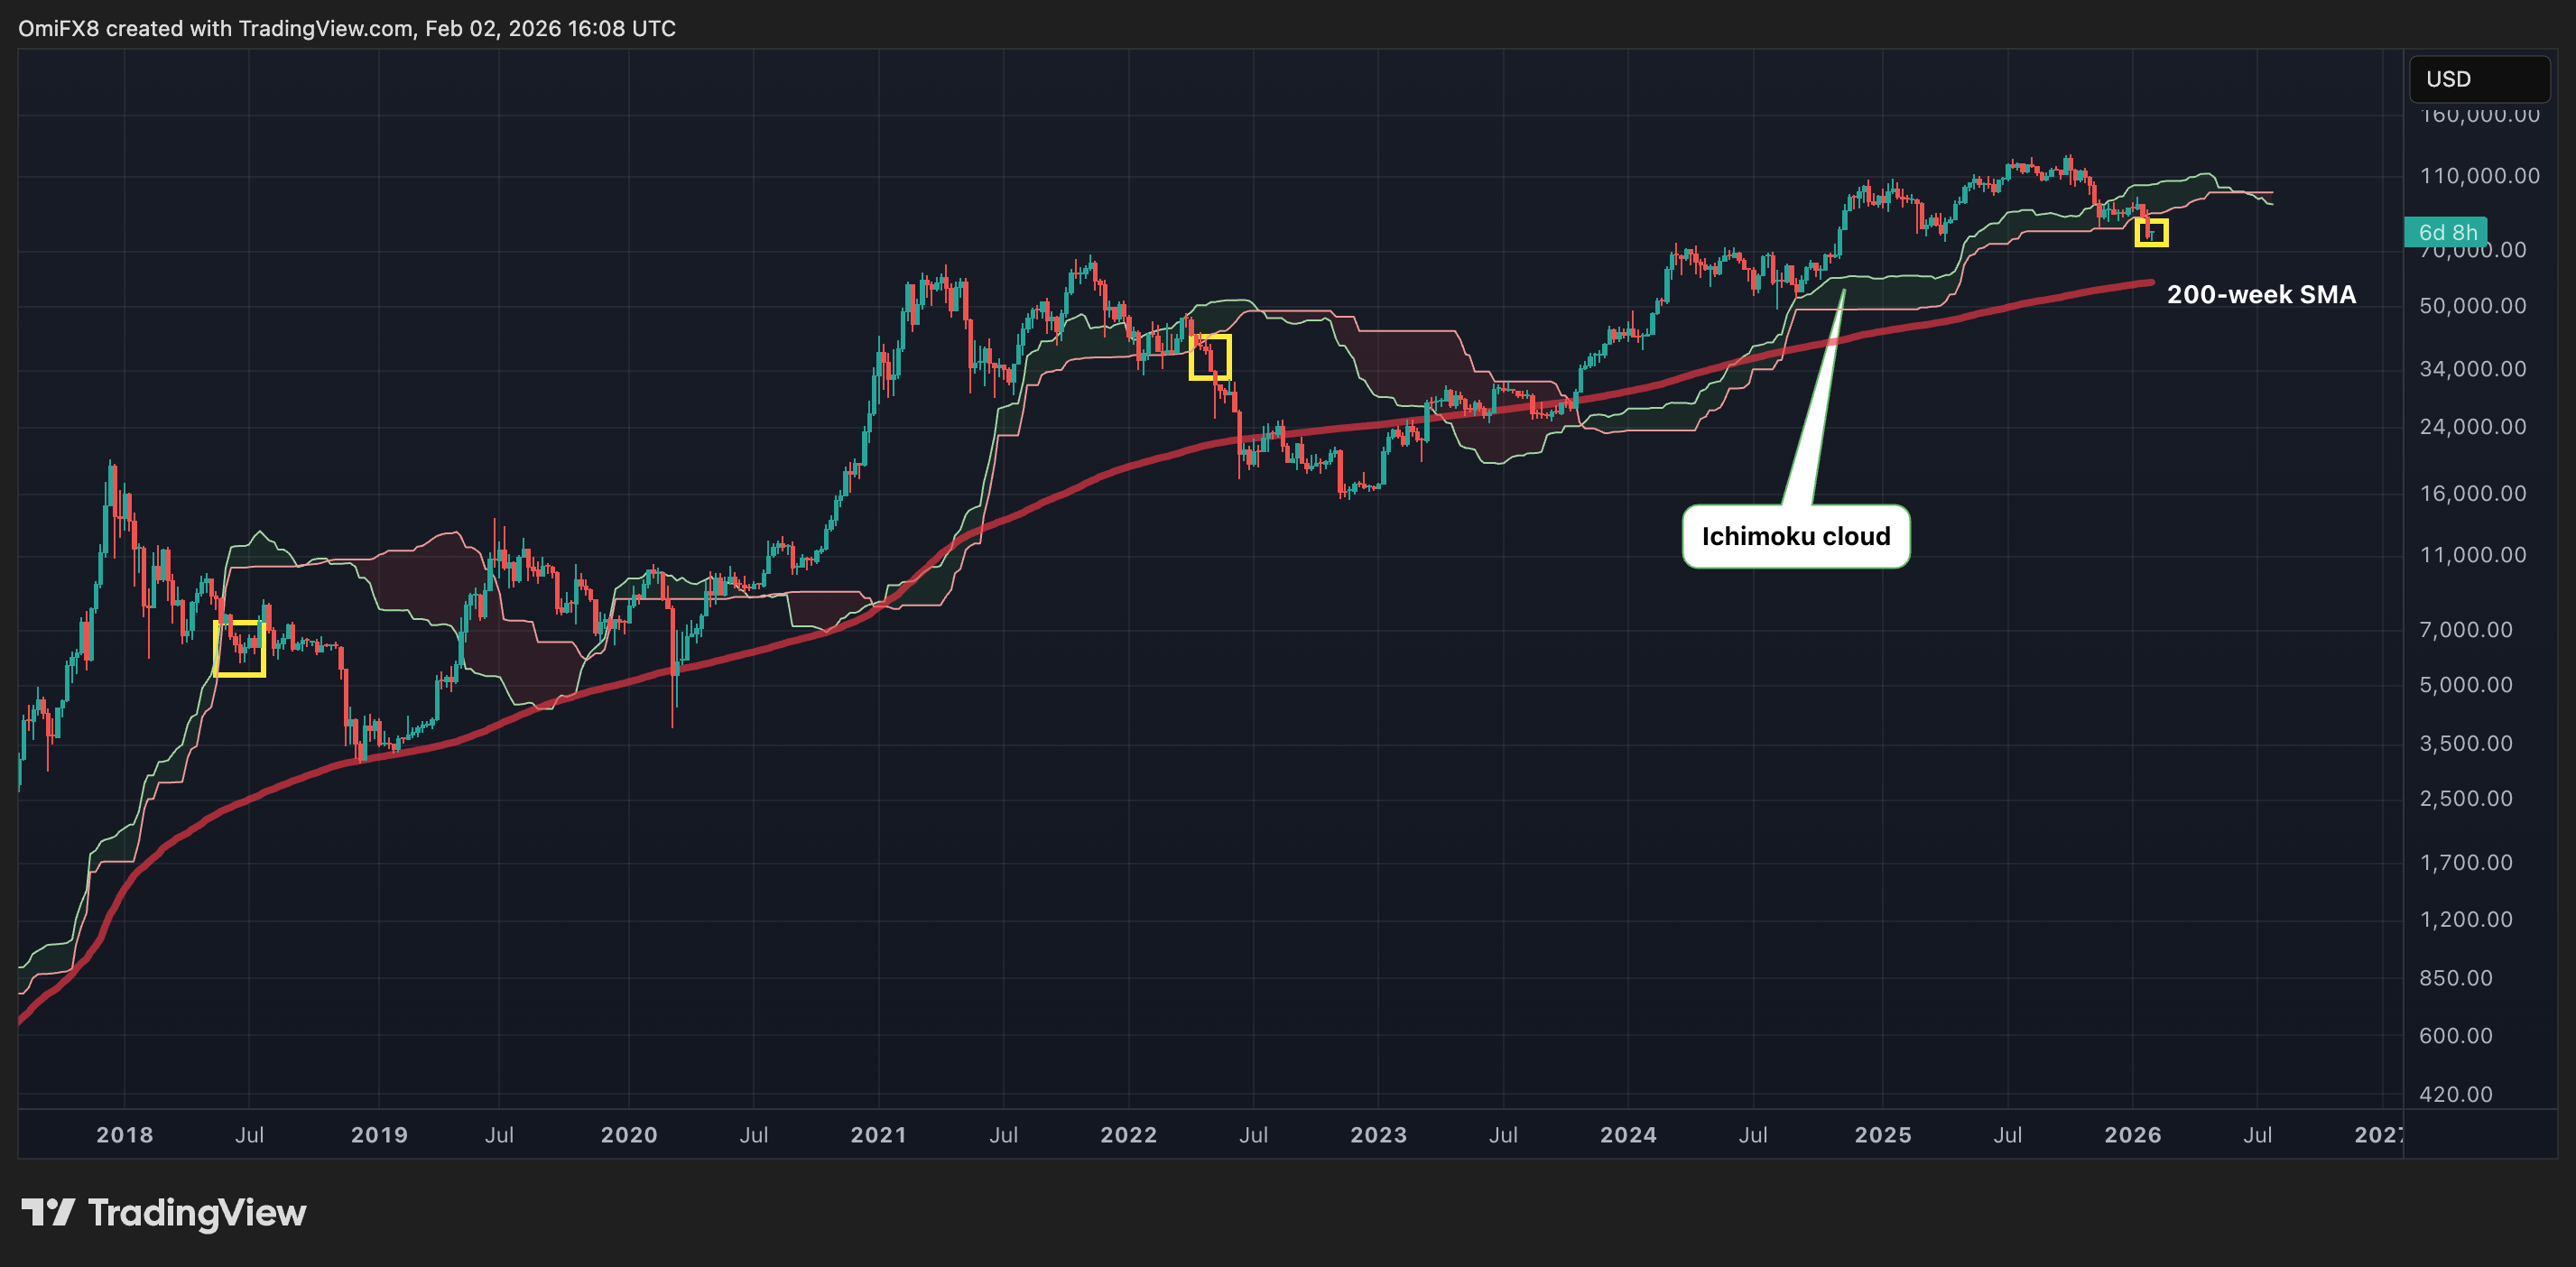
Last week's selloff caused Bitcoin to drop below the Ichimoku cloud, a technical indicator that measures momentum, support, and resistance. If the price remains above the cloud, it indicates a solid bullish trend with strong upward momentum. When the price falls below that, the market becomes anemic, weak and exposed to long-term weakness, like a human body lacking iron.
Bitcoin just broke below the cloud on the weekly chart, a bearish shift marking the beginning of the deepest and most painful bear market phase in history.
It also appears to broadly track the four-year cycle theory, which is driven by a halving schedule that cuts new supply by 50% approximately every four years and is partly the reason for cyclical bull and bear markets.
During the 2015 bear market, Bitcoin traded just above $200, consistently using the 200-WMA as support. During the 2018-2019 bear market, the 200-WMA hovered just above $3,000, briefly collapsing during the coronavirus-induced market crash in March 2020, but once again acting as support.
In the last cycle, Bitcoin fell below the 200-WMA in June 2022, to levels below $22,000, and then remained there for an extended period of time. Price did not regain the 200-WMA line until October 2023, confirming its role as a long-term trend support line.
While there are no guarantees, the recent price decline below the Ichimoku cloud indicates that another sustained bear market phase may be imminent, but at least there is a proven support level to provide some encouragement.
Updated (February 2, 16:55 UTC): Rewrite the heading