

Bitcoin price is facing resistance at $116,000, which is the confluence zone of the high timeframe. The multiple rejections have raised concerns that a bullish trap could form if prices lose momentum and key levels.
summary
- $116,000 coincides with a major resistance level and a Fibonacci confluence.
- If you fail to hold a control point, you risk falling into a bull trap.
- If the rejection continues, $106,000 will serve as important high timeframe support.
Bitcoin (BTC) price soared to the $116,000 level on Tuesday, testing a highly significant resistance zone that combines several major technical confluences. While the move has fueled bullish excitement across markets, there are growing warning signs that this level could form the basis of a bullish trap, especially as Germany's AfD party, the country's second-largest party, has proposed creating a strategic Bitcoin reserve following a similar initiative in France, sparking renewed speculative interest around the zone.
Important technical points for Bitcoin price:
- Key Resistance Zones: $116,000 coincides with 0.618 Fibonacci, VAH, and high timeframe resistance.
- Price Reaction: Multiple rejections occur on lower time frames, suggesting depletion.
- Important Support: Point of Control (POC) and support at $106,000 remain important to defend.
You may also like: Bitwise Solana ETF records debut with $69.5 million inflows
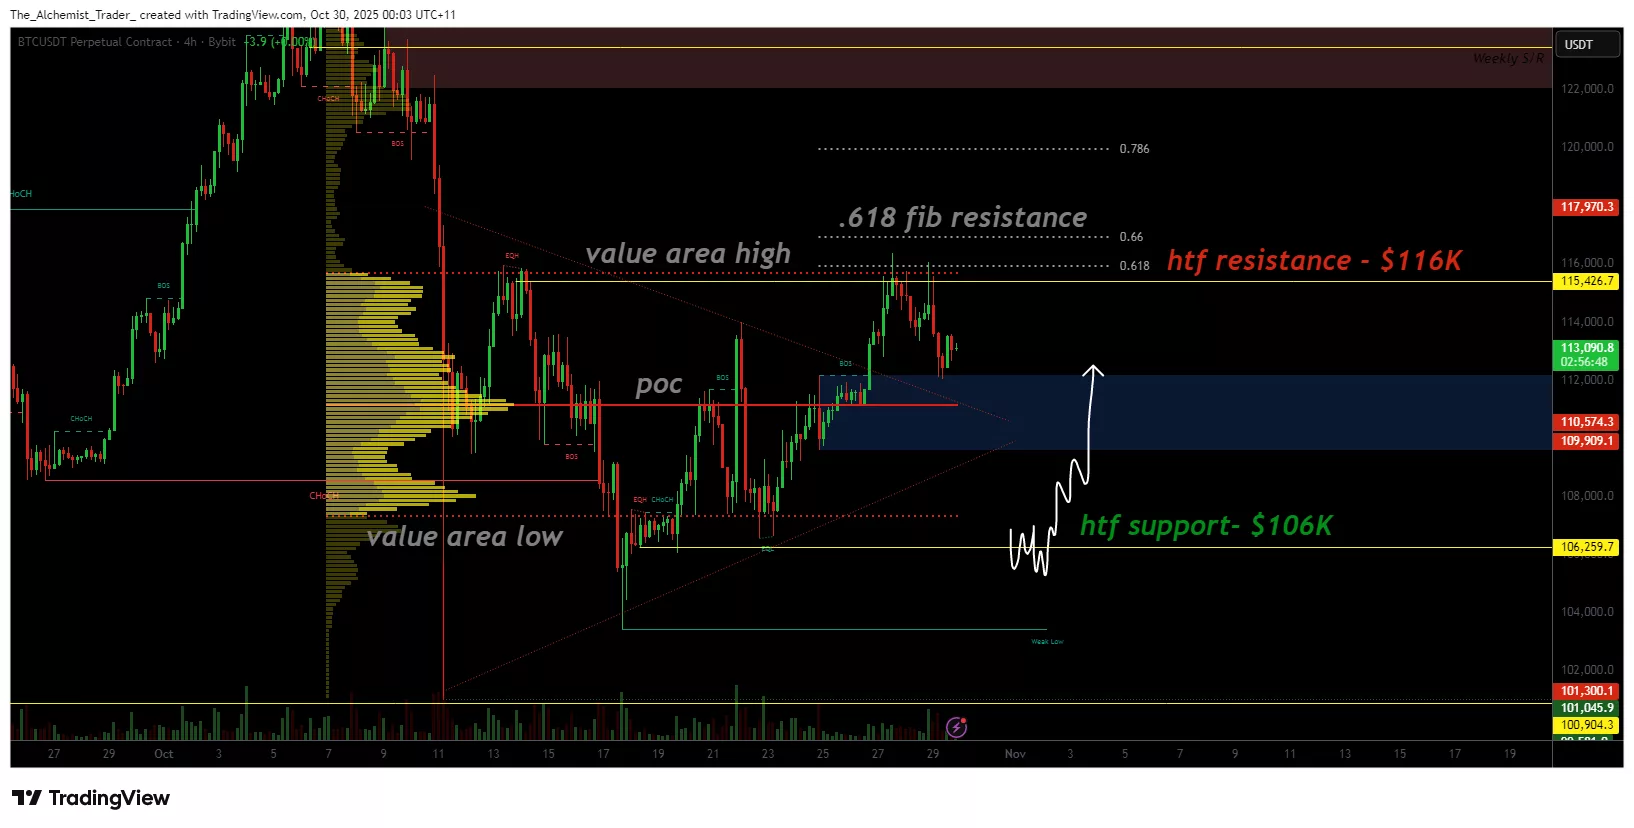
BTCUSDT (4H) chart, source: TradingView
From a technical perspective, Bitcoin’s approach to $116,000 has triggered a series of rejections on a shorter time frame, suggesting that bullish momentum is starting to stall. This region acts as a cluster of technical resistance, with sellers aggressively defending the upper bound of the current trading channel.
Price has since corrected slightly, moving below the high of the value area and approaching the Point of Control (POC), an important volume-based level that often acts as a midpoint equilibrium point. This is an important level for bulls. If Bitcoin fails to sustain above POC, the bullish trap will likely be confirmed and lead to a deeper correction towards the $106,000 high timeframe support zone.
You may also like: Mono Protocol’s Stage 15 Development, Community Rewards Make It One of The Most-Watched Cryptocurrency Presales
The $106,000 area also coincides with the Value Area Low (VAL), indicating a strong structural demand zone. A loss of POC will likely accelerate selling pressure on this support, confirming the bullish trap setup that is building at $116,000.
The broader market structure remains cautiously bullish, but increasingly vulnerable. As long as Bitcoin remains below the $116,000 resistance cluster, momentum is likely to continue to wane. The risk of a bullish trap becomes more pronounced if volume declines while price attempts and fails to retest this level.
Alternatively, a decisive return to $116,000 on strong volume could invalidate the bearish theory and open the door for a new bullish continuation towards $124,000. However, absent confirmation, traders should approach this level with caution, and technical evidence currently supports a short-term correction.
What to expect from future price trends
If Bitcoin loses its control point, the price could quickly rotate towards the $106,000 support and form a larger intra-range structure between $106,000 and $116,000. This could lead to a prolonged consolidation phase as traders reassess directional bias.
read more: Despite the ETF buzz, Solana's price has stalled below $200, but could it break out?