

Bitcoin price may be gearing up for a rebound in a cleaner setup after a long period of deleveraging.
summary
- Bitcoin is trading close to $87,000 after a massive leverage flush that eliminated excessive long positions.
- CryptoQuant analysts say fears, oversold readings and declining open interest could support a modest recovery.
- The chart is still in a bearish trend, with the average down and momentum weak.
At the time of writing, Bitcoin was trading around $86,646, up 0.6% in the past 24 hours. The daily range was between $85,483 and $87,995. The coin remains down 10% over the past week after falling 31% from its all-time high of $126,080 set on October 6th.
Trading volume in the past 24 hours rose 46% to $64.7 billion, marking a temporary spike in activity after days of heavy selling.
Derivatives trading volume increased 35% to $93 billion, and open interest increased 0.64%, according to CoinGlass data. Slightly higher open interest and increased volume often means traders are returning to the market after a liquidation flush, but positioning remains cautious.
A decline in open interest could indicate a price reversal
A November 21 analysis by CryptoQuant contributor Darkfost points to major structural changes in derivatives. He noted that Bitcoin (BTC) open interest (measured in BTC) had the strongest 30-day decline of the entire cycle, with Binance alone losing approximately 1.3 million BTC in open interest contracts.
Dirkforst said this type of decline “hasn't appeared since the 2022 bear market,” adding that the current cleanup is “much more meaningful than many traders are acknowledging.”
You may also like: VanEck CEO warns about Bitcoin encryption and privacy
He noted that the market is driven largely by leveraged positions, with total open interest reaching an all-time high of nearly $47.5 billion early in the cycle. He described the ongoing cleanup as a natural reset after a long period of speculative positioning.
Another CryptoQuant analyst, gigisulivan, noted that the short-term SOPR has fallen below 0.94, saying this is a reliable sign of a domestic bottom this year. They also highlighted oversold readings on the 3-day and daily time frames, along with extreme fear in sentiment.
They expect Bitcoin to recover towards the $99,000 to $105,000 range before encountering stronger resistance, but caution that a quick move above $100,000 often fuels a premature bullish narrative.
Their outlook suggests the price could fluctuate between $78,000 and $105,000 for several months until the market finds a clearer direction.
Technical analysis of Bitcoin price
Bitcoin's chart shows a clear downward trend from late October to November, with falling highs and falling lows forming a clear descending structure. Price is still near the lower end of the Bollinger Bands, indicating continued weakness rather than a stable base.
The candlestick is still below the 20-day moving average and the 50-day moving average, both of which are trending down, confirming steady bearish pressure.
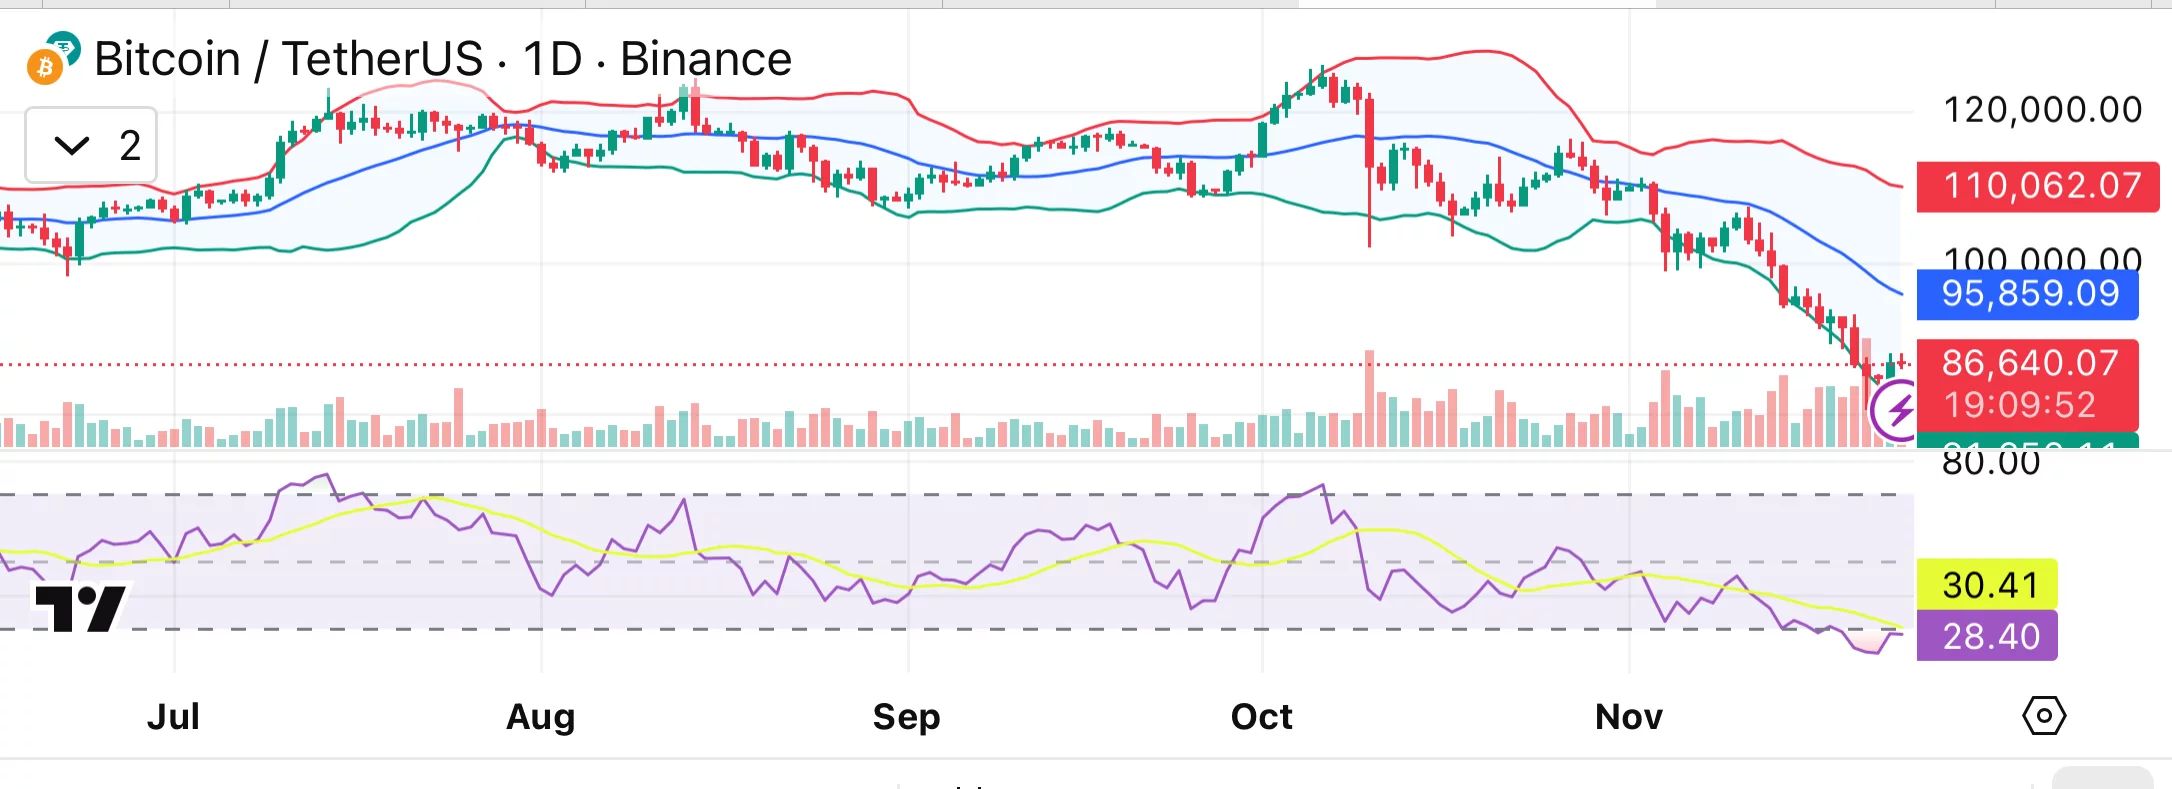
Bitcoin daily chart. Credit: crypto.news
Momentum readings are showing mixed signs. Even though the relative strength index is well in oversold territory at 29, there are still no obvious signs of a reversal. Although the stochastics are low, the strength has not recovered.
An increase in the average directional index indicates a strong trend that has not weakened enough to indicate a change in direction. The MACD and the great oscillator are negative, indicating that buyers have not regained momentum yet.
Support is located near the mid-$80,000 zone. If buyers fail to defend that area, the market could retest levels closer to $80,000. Resistance is near the $90,000 area and then in the psychological $100,000 zone.
read more: Robert Kiyosaki sells $2.25 million in Bitcoin: Here's what changed his mind