

Bitcoin price started a decent rise above $92,000. BTC is currently consolidating its gains and could aim for further gains if it breaks above $93,400.
- Bitcoin started a downward correction from the $94,500 zone.
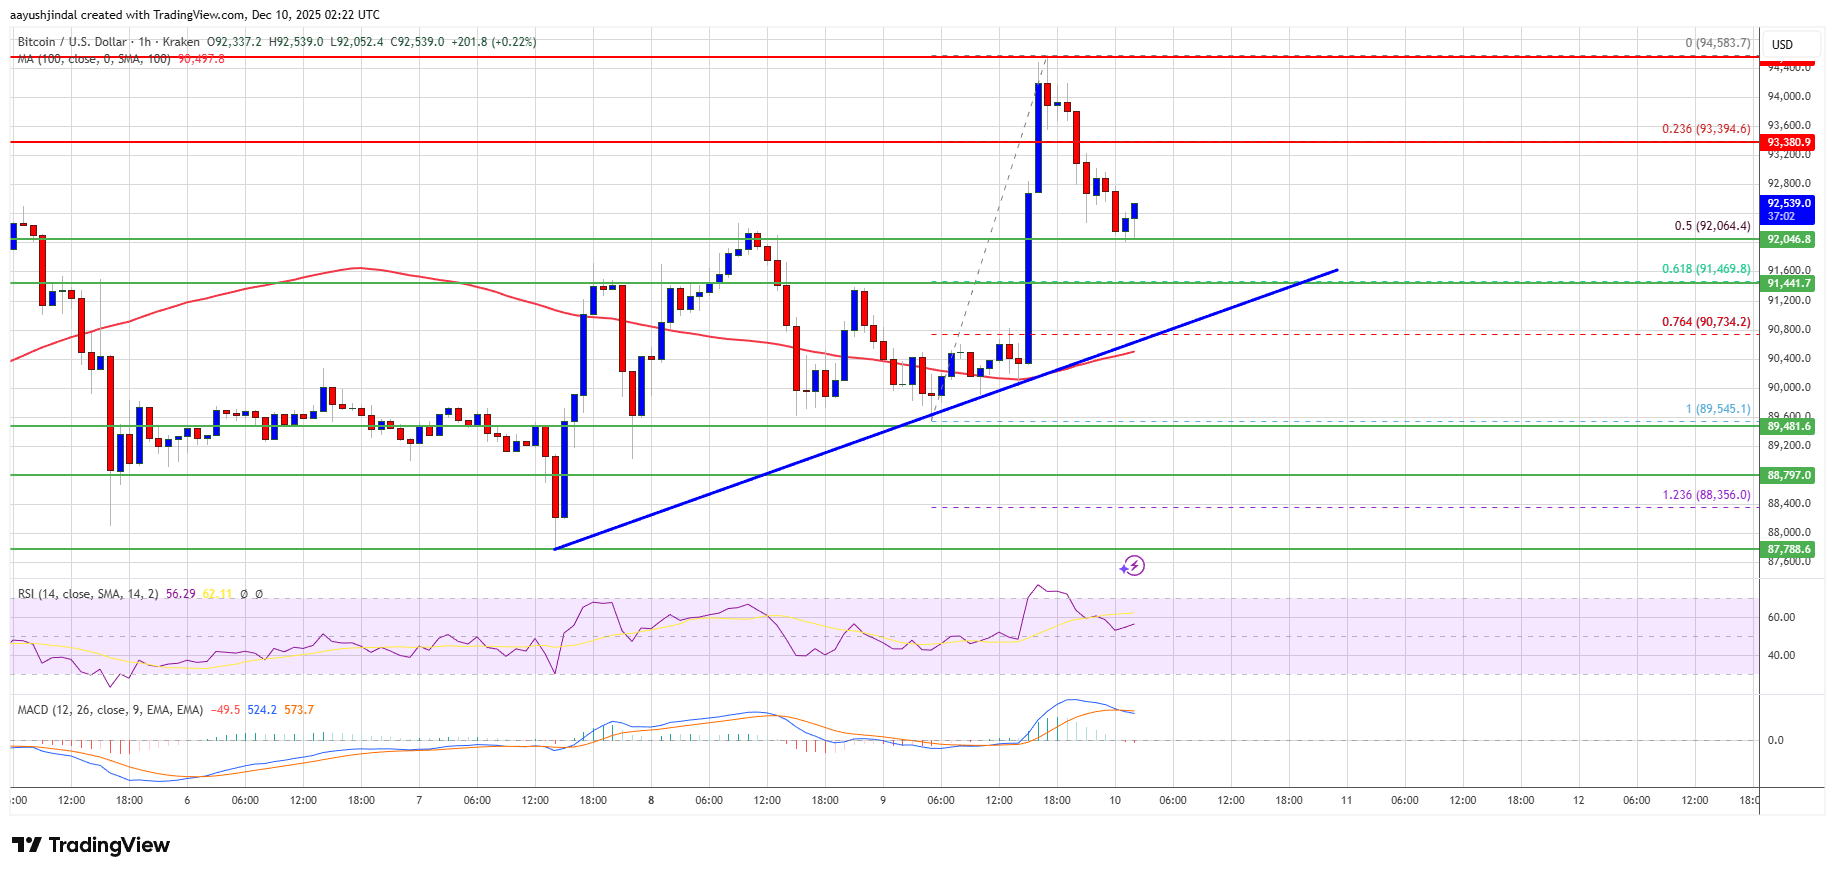
- The price is trading above $92,000 and the 100 hourly simple moving average.
- On the hourly chart of the BTC/USD pair, a bullish trend line is forming with support at $91,500 (data feed from Kraken).
- If it settles above the $93,400 zone, the pair could continue moving higher.
Bitcoin price maintains support
Bitcoin price managed to maintain above the $91,000 zone and started a new rally. BTC gained momentum towards a rally above the $92,500 and $94,000 levels.
However, the bears remained active near $94,500. The high was formed at $94,583, and the price has recently corrected some gains. There was a decline towards the 50% Fib retracement level of the bull market from the swing low of $89,545 to the high of $94,583.
However, the bulls were active around the $92,000 support. Bitcoin is currently trading below $92,000 and its 100 hourly simple moving average. Furthermore, the hourly chart of the BTC/USD pair has formed a bullish trend line with support at $91,500.
If the bulls continue their action, the price could try to move higher. Immediate resistance is near the $92,800 level. The first major resistance level is near the $93,200 level. The next resistance level could be at $94,000. If the price closes above the $94,000 resistance level, the price could move higher. In the above case, the price could rise and test the $94,500 resistance. Any further rise could push the price closer to the $95,500 level. The next hurdles for the bulls could be $96,200 and $96,500.
Further losses for BTC?
If Bitcoin fails to rise above the $94,000 resistance zone, further decline could begin. Immediate support is near the $92,000 level. The first major support is around the $91,500 level and the 61.8% Fib retracement level of the upward movement from the swing low of $89,545 to the high of $94,583.
The next support is currently located near the $90,750 zone. Any further losses could send the price towards the $90,000 support in the near term. The main support lies at $88,800, below which BTC could accelerate its decline in the short term.
Technical indicators:
Hourly MACD – The MACD is currently pacing in the bullish zone.
Hourly RSI (Relative Strength Index) – BTC/USD’s RSI is currently above the 50 level.
Major support level – $92,000, then $91,500.
Key resistance levels – $93,200 and $94,000.