

Bitcoin price is trying to recover above $107,500 and $108,000. If BTC can break out of the $109,500 resistance zone, it could continue moving higher.
- Bitcoin has started a new wave of recovery above the $105,000 resistance level.
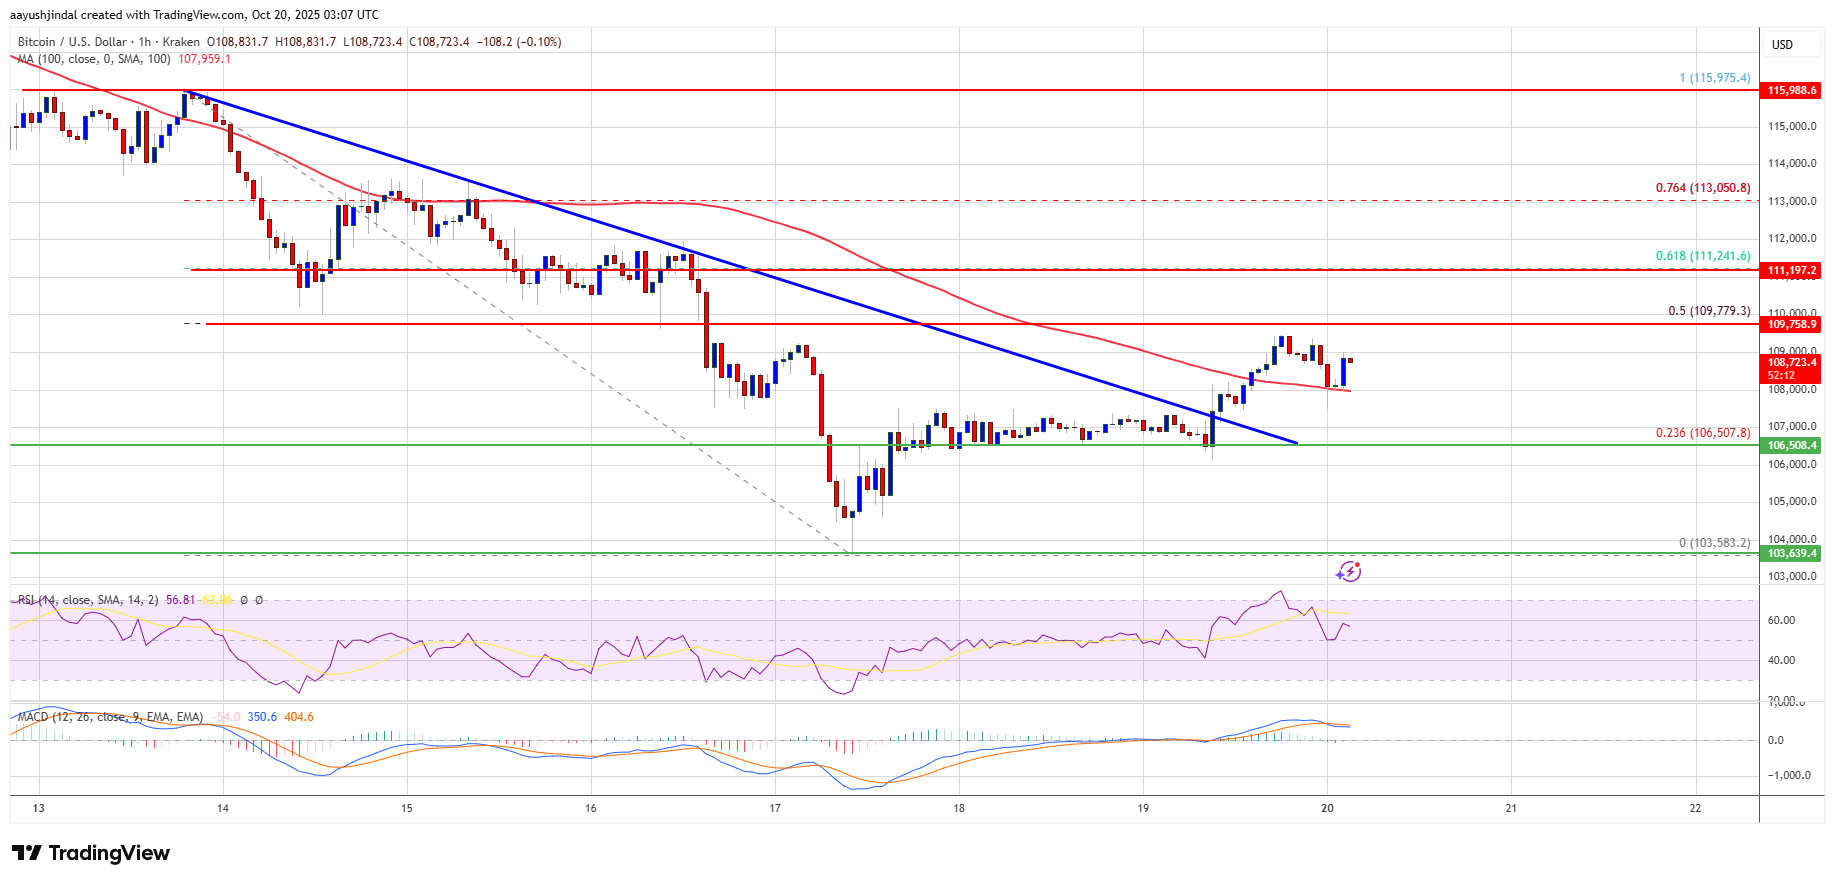
- The price is trading above $108,000 and the 100-hour simple moving average.
- On the hourly chart of the BTC/USD pair (data feed from Kraken), the pair broke above the bearish trend line with resistance at $107,500.
- If it trades above the $109,500 zone, the pair is likely to continue moving higher.
Eyes on Bitcoin price recovery
Bitcoin price failed to cross the $110,000 resistance level and a new decline began. BTC fell below the $108,000 and $106,500 support levels and entered the bearish zone.
Prices could even fall below $105,000. A low was formed at $103,583, with the price correcting some losses. There was a move above the 23.6% Fib retracement level of the recent decline from a swing high of $115,975 to a low of $103,583.
Additionally, on the hourly chart of the BTC/USD pair, the pair broke above the bearish trend line with resistance at $107,500. Bitcoin is currently trading above $108,000 and its 100-hour simple moving average.
Immediate upside resistance is near the $109,500 level. The first major resistance level is near the $110,000 level. The next resistance level could be $111,250 and the 61.8% fib retracement level of the recent decline from a swing high of $115,975 to a swing low of $103,583.
If the price closes above the $111,250 resistance level, the price could move higher. In the above case, the price could rise and test the $112,500 resistance. Further upside could push the price towards the $113,200 level. The next barrier for the bulls could be $115,000.
Will BTC fall again?
If Bitcoin fails to rise above the $110,000 resistance zone, a new decline could begin. Immediate support is near the $108,000 level. The first major support is near the $107,500 level.
The next support is currently located near the $106,200 zone. Any further losses could send the price towards the $105,500 support in the short term. The main support lies at $103,500, below which BTC may struggle to recover in the short term.
Technical indicators:
Hourly MACD – The MACD is currently pacing in the bullish zone.
Hourly RSI (Relative Strength Index) – BTC/USD’s RSI is currently above the 50 level.
Major support levels – $108,000, followed by $106,500.
Key resistance levels – $109,500 and $111,250.