


Bitcoin price fell below $88,000 and started falling again. BTC is currently trying to recover and may face a hurdle near the $89,500 zone.
- Bitcoin began a new decline below $90,000 and $88,000.
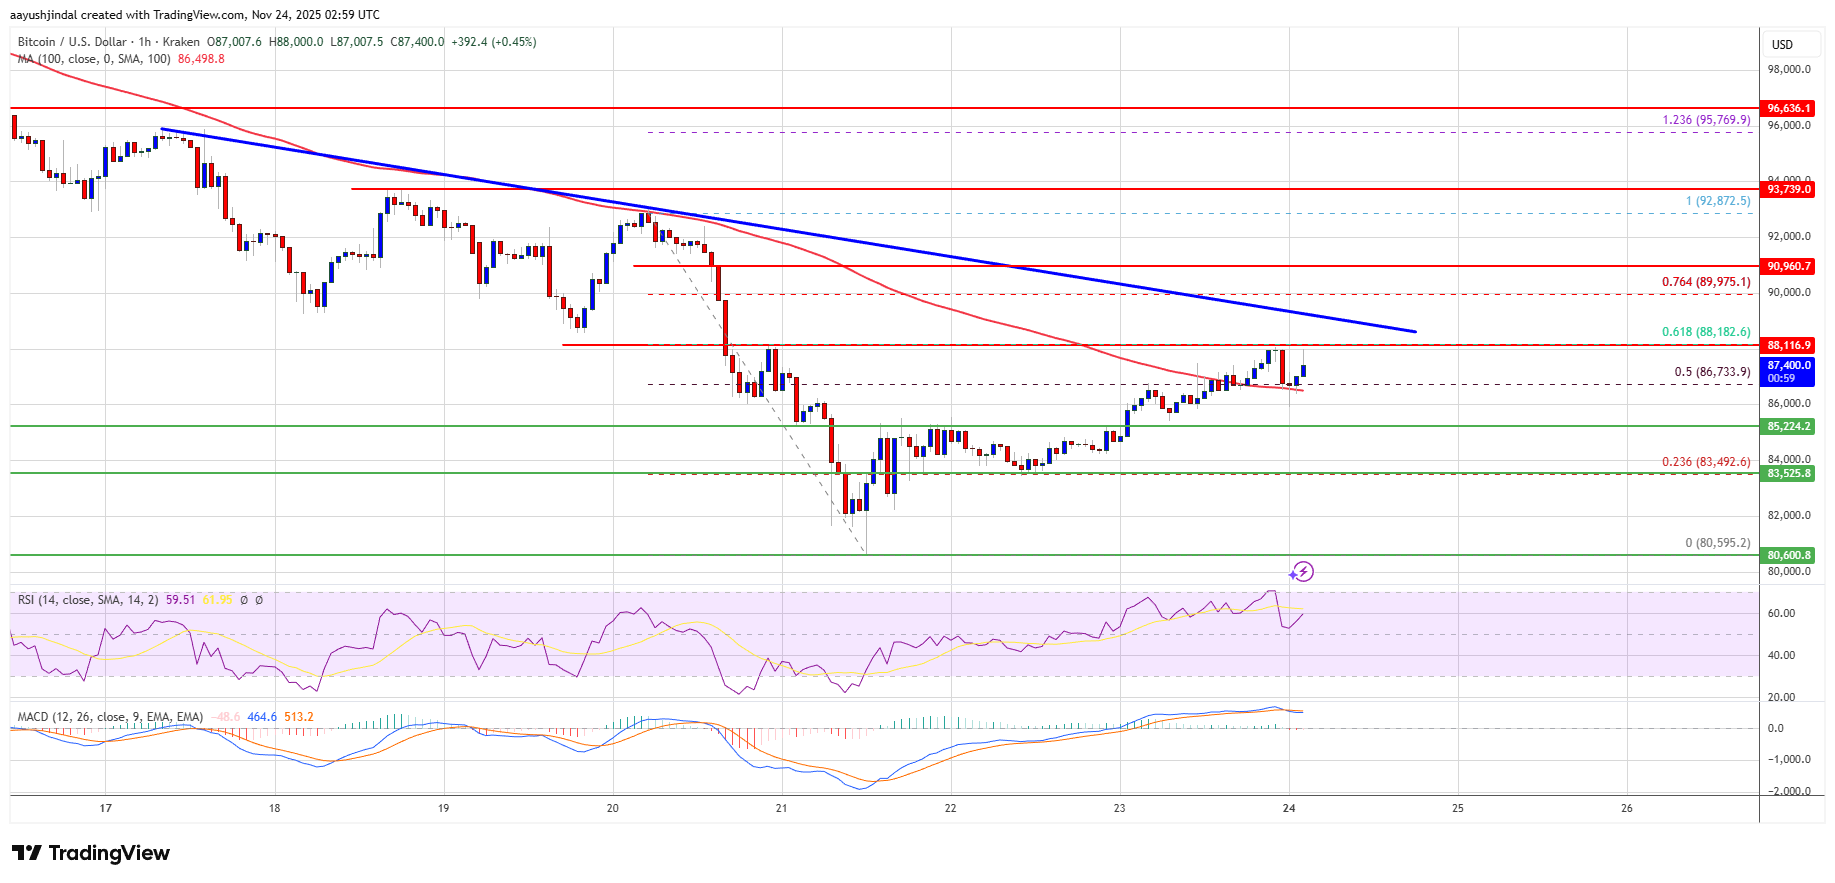
- The price is trading below $89,000 and the 100 hourly simple moving average.
- The hourly chart of the BTC/USD pair (data feed from Kraken) has a bearish trendline forming resistance at $89,500.
- If we break below the $85,000 zone, the pair could continue to fall.
Bitcoin price tries to recover
Bitcoin price was unable to stay in positive territory above $90,000. BTC bears remained active below $88,000, pushing the price lower.
The bears gained momentum and were able to push the price below the $85,000 zone. A low was formed at $80,595 and the price is currently attempting to recover. There was more than $85,000 in movement. The price has risen above the 50% Fib retracement level of the recent decline from a swing high of $92,872 to a low of $80,595.
Bitcoin is currently trading below $89,000 and its 100-hourly simple moving average. Additionally, a bearish trend line has formed on the hourly chart of the BTC/USD pair with resistance at $89,500.
If the bulls attempt another wave of recovery, the price could face resistance near the $88,150 level and the 61.8% fibritracement level of the recent decline from a high of $92,872 to a low of $80,595. The first significant resistance is near the $89,500 level and trendline.
The next resistance level could be at $90,000. If the price closes above the $90,000 resistance, the price could move higher. In the above case, the price could rise and test the $92,500 resistance. Further upside could push the price towards the $93,200 level. The next hurdles for the bulls could be $94,500 and $95,000.
Further losses for BTC?
If Bitcoin fails to rise above the $89,500 resistance zone, further decline could begin. Immediate support is near the $86,500 level. The first major support is near the $85,000 level.
The next support is currently located near the $83,500 zone. Any further losses could send the price towards the $82,500 support in the near term. The main support is at $80,000, below which BTC could accelerate its decline in the short term.
Technical indicators:
Hourly MACD – The MACD is currently losing pace in the bearish zone.
Hourly RSI (Relative Strength Index) – BTC/USD’s RSI is currently above the 50 level.
Major support levels – $86,500, followed by $85,000.
Key resistance levels – $89,500 and $90,000.