

BNMR stock has declined for the third day in a row and could be at risk of further decline as Ethereum forms a dangerous bearish flag pattern on the daily chart.
summary
- BMNT stock may be at risk of a strong bearish breakout.
- On the daily chart, it forms a symmetrical triangle pattern.
- Ethereum has formed a bearish flag pattern, indicating further downside.
Bitmine Immersion, which is chaired by Tom Lee, fell to $31.12, its lowest price since December 2nd. The company is valued at $13 billion, down about 80% from this year's high.
The stock price fell further as the company continued its Ethereum (ETH) accumulation strategy. The company reported that its Ethereum holdings increased to 3.97 million and total assets increased to $13.2 billion. Last week, 102,259 coins were purchased and management plans to continue this trend.
You may also like: After NFP data, technical rebound and XRP price stabilizes
BitMine is now the second largest crypto company in the industry, behind Michael Saylor's Strategy. The plan is to benefit from a potential rebound in Ethereum price in the long run. Additionally, the company plans to launch its MAVAN staking solution in 2026, which will allow it to generate millions of dollars in annual revenue.
Still, BMNR stock faces significant risks as Ethereum price forms a bearish flag pattern on the daily chart. This pattern often leads to further declines.
Additionally, the stock remains below all moving averages and supertrend indicators, suggesting a significant bear market could occur in the coming weeks, dropping from the current $2,940 to $2,500.
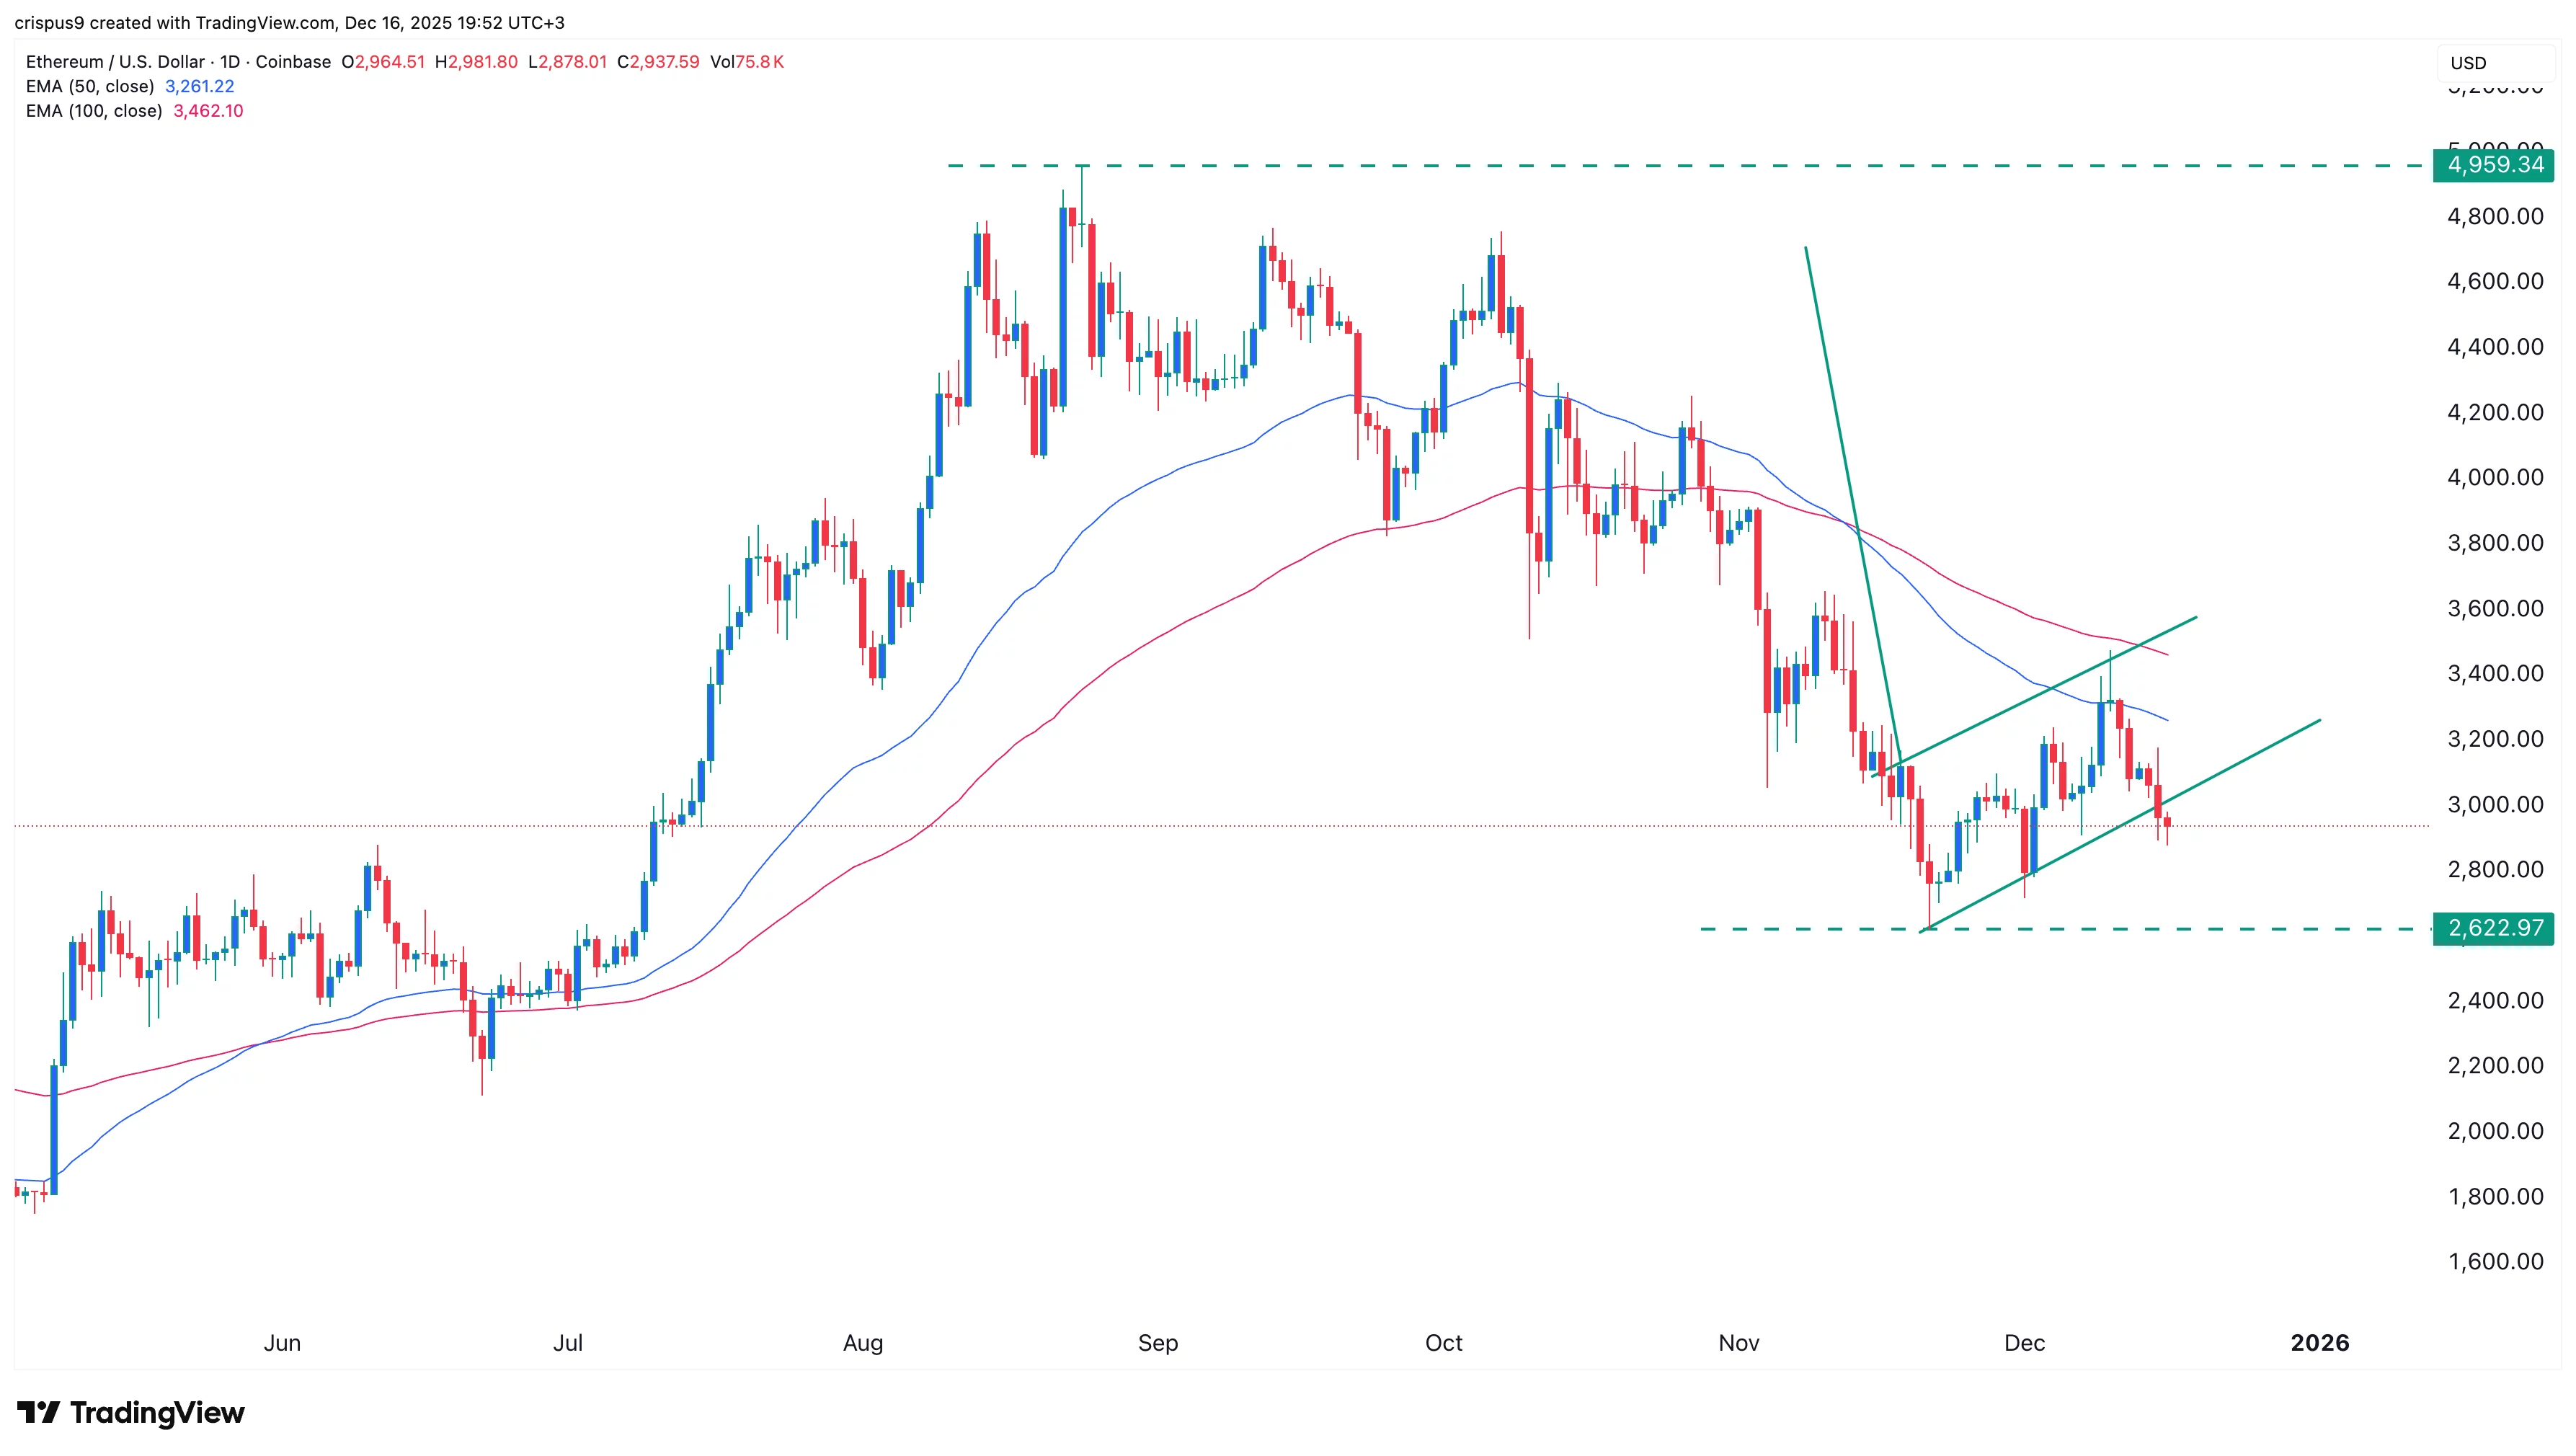
However, in the long term, Ethereum's price is likely to recover and reach all-time highs, supported by fundamentals such as increasing market share in key industries such as decentralized finance (DeFi), tokenization of real-world assets, and non-fungible tokens (NFTs).
BMNR Stock Price Technical Analysis
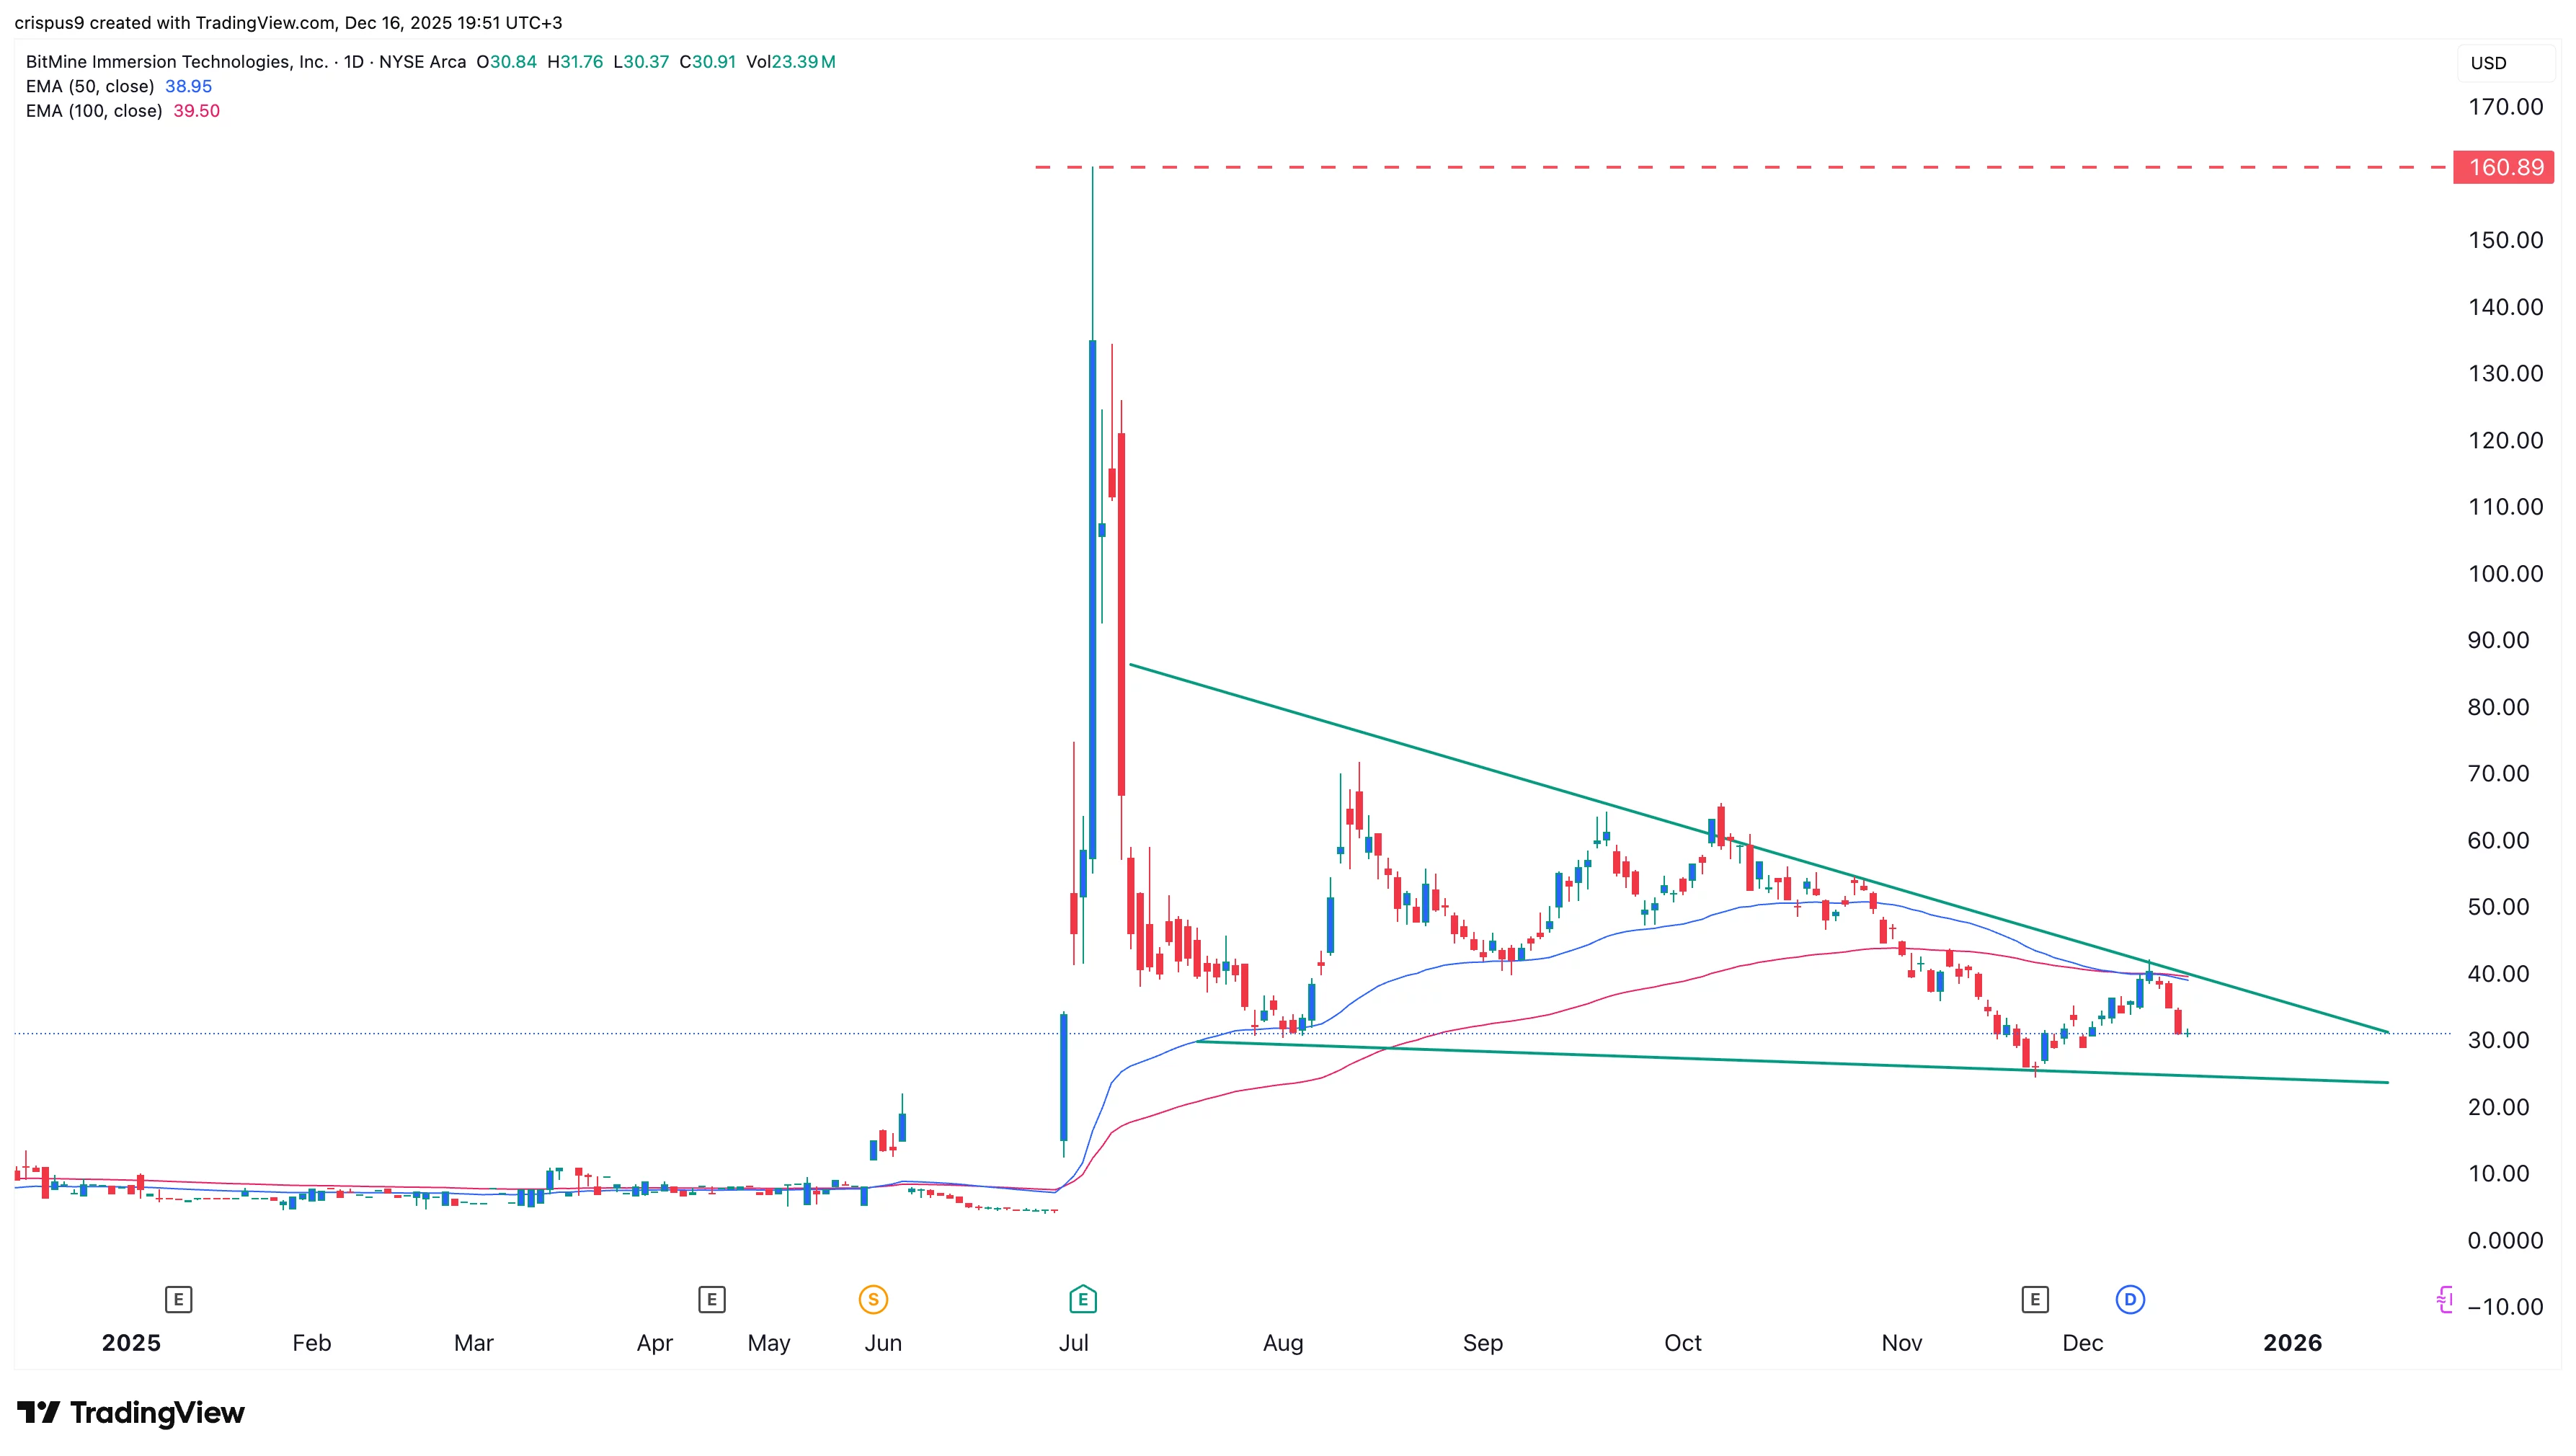
BitMine stock price chart |Source: crypto.news
The daily chart shows that BitMine's stock price has plummeted over the past few months. The stock has fallen from a high of $160 in July to $30.5 today.
The stock price has fallen below the top of the symmetrical triangle pattern. This triangle is nearing a confluence, indicating that a bearish breakout could occur soon.
The BMNR strain formed a mini-death cross pattern. The 100-day moving average and the 50-day moving average have formed a bearish crossover. Therefore, the stock price could continue to fall as sellers target the key support level at $20.
read more: Shiba Inu price shows signs of early reversal due to double-dip formation