

Ethereum price has stalled amid cooling US demand, failing in another attempt to climb above $3,300.
summary
- Ethereum failed to regain the $3,300 resistance despite a slight weekly rally.
- On-chain data shows that US institutional demand is waning as Coinbase’s premium gap falls to a 10-month low.
- Derivatives positioning and ETF outflows suggest traders remain cautious and bear downside risks.
ETH is hovering around $3,115 at the time of writing, down 0.7% in the past 24 hours. Last week, the token traded between $3,008 and $3,293, ending the period up about 3%. Ethereum (ETH) is still well below its August 2025 high and about 37% below its high of $4,946.
Trading has also been fairly calm. Spot trading volume rose only modestly by 0.7% to $23 billion, indicating that buyer interest is waning.
Derivatives revealed a mixed setting. Volume rose 3.8% to $73 billion, while open interest fell 1.4% to $40 billion, according to CoinGlass data.
If open interest is decreasing while trading volume is increasing, it often means that traders are moving or exiting positions rather than placing new leveraged bets.
Coinbase’s premium gap deepens
On-chain signals added to that vigilance. A January 8 analysis by CryptoQuant contributor CryptoOnchain showed that Ethereum’s Coinbase premium gap has fallen further into negative territory. The 14-day moving average for this indicator has fallen to approximately -2.29, the lowest level since early February 2025.
You may also like: Vitalik Buterin says Ethereum's latest upgrade is rewriting the blockchain rulebook
Coinbase Premium Gap tracks the price difference between Coinbase, which is often seen as an indicator of US institutional investor activity, and Binance, which reflects trades across global markets. When the gap turns negative, it generally indicates that buying intent on Coinbase is weakening.
In past cycles, if this indicator remained positive, a sustained upward trend tended to emerge. That pattern never returned.
The flow of exchange-traded funds tells a similar story. The US Spot Ethereum ETF recorded net outflows of $51.5 million on January 8, the second consecutive day of withdrawals, weighing on short-term sentiment.
Ethereum technical analysis
Ethereum appears to be in a correction phase. On the daily chart, we can see that the highs are still low, indicating a lack of strong upward momentum. None of the recent recoveries were long-lasting. Price action remains below the 50-day moving average near $3,260, limiting any repeat upside movement.
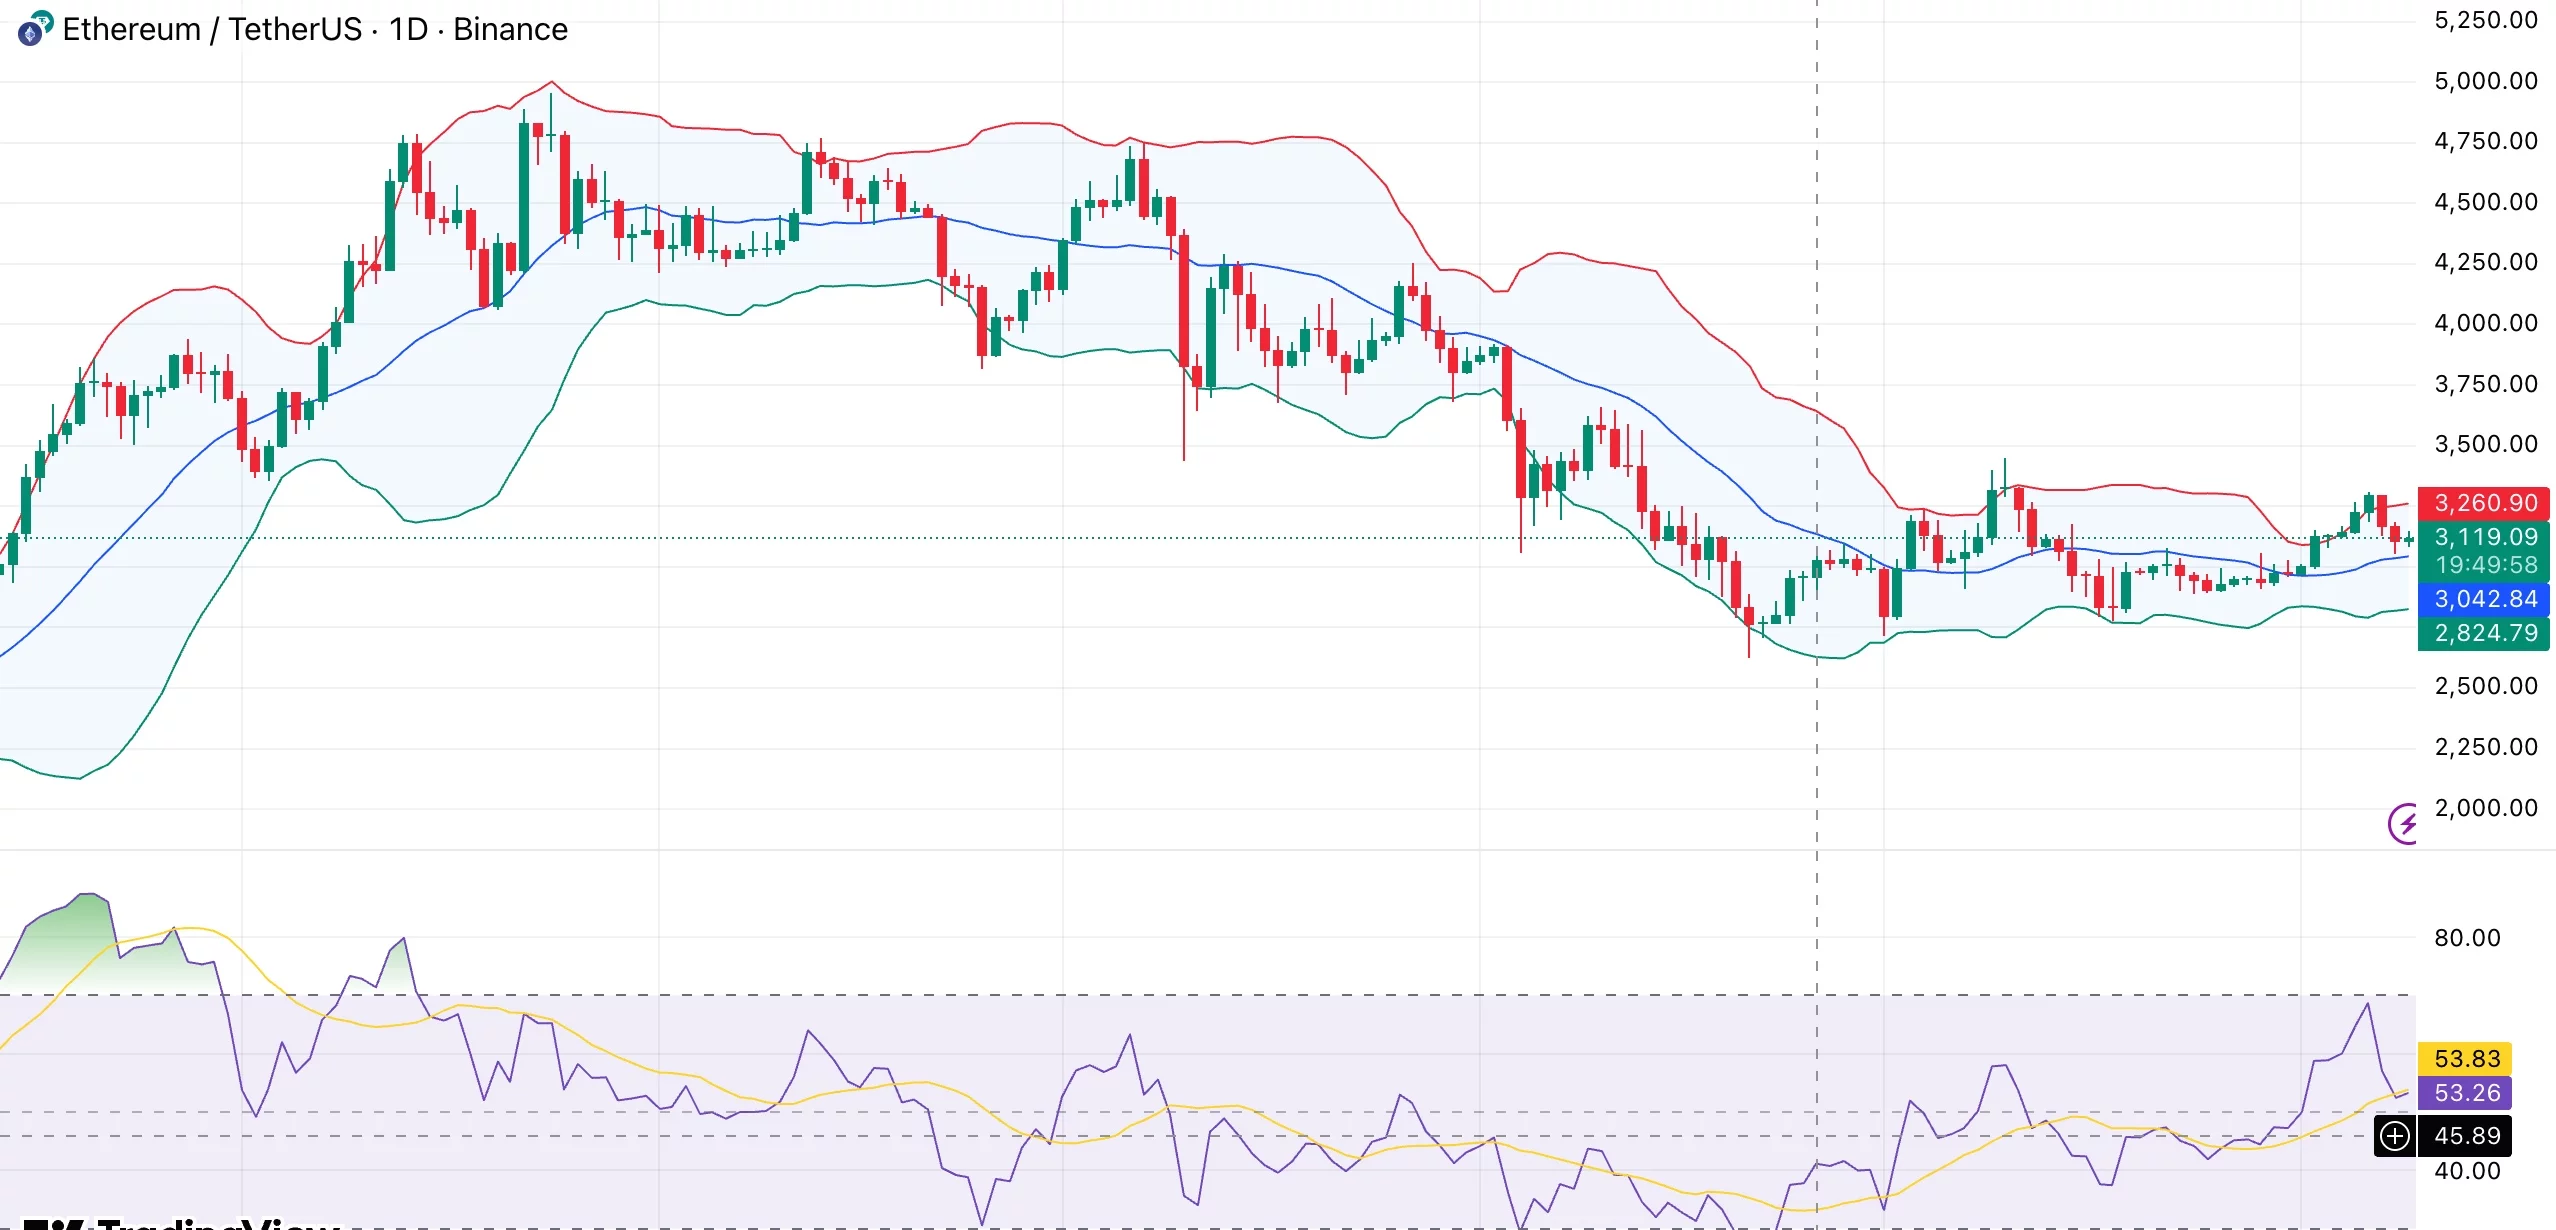
Ethereum daily chart. Credit: crypto.news
ETH is in the middle of the Bollinger Bands range. The price has repeatedly moved away from the upper band near the $3,300 resistance zone. The band width is slightly narrower and is often set before a large move, but is not directional in and of itself.
Momentum indicators are stable at neutral levels. After recovering from oversold conditions, the 14-day Relative Strength Index is near 53, but still short of the strength seen in the secular bull market. The recent green candlestick has also become smaller, indicating that buyers remain cautious and selective.
The outlook will improve if the daily close is cleanly above $3,300, and attention will shift to the $3,500-$3,600 zone. If this level continues to hold, the downside focus will return to the $3,000-$3,050 area, with more risk towards $2,800 if selling pressure increases.
read more: Bitcoin holds $90,000 as unemployment claims show cooling as Fed officials push for rate cuts