Ethereum has rebounded slightly after a significant drop that saw its price drop below $4,000. The overall market remains cautious as traders reassess their positions following recent volatility, which could lead to a reversal of the bullish trend.
technical analysis
Written by Shayan
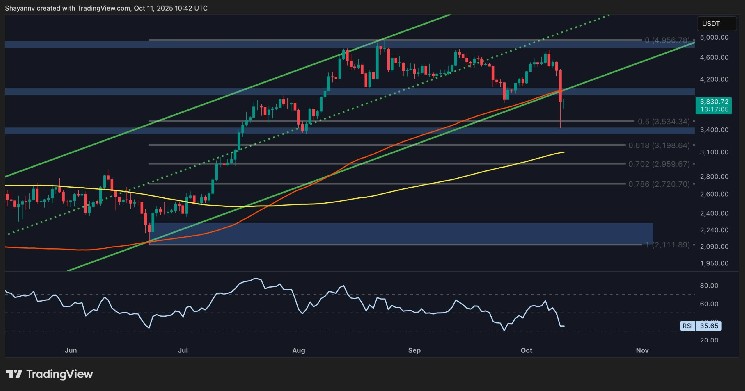
daily chart
On the daily time frame, ETH recently fell below the 100-day moving average, the midline of the ascending channel, and touched the 0.5 Fibonacci retracement level around $3,400-$3,500. This zone coincides with previous structural support and triggers a rebound towards $3,800.
However, the RSI is still below 40 and momentum is weak. A daily close above $4,000 could signal a short-term recovery, but if the channel cannot be regained, ETH will likely fall below the $3,000 range, which would spell the end of the bull market.

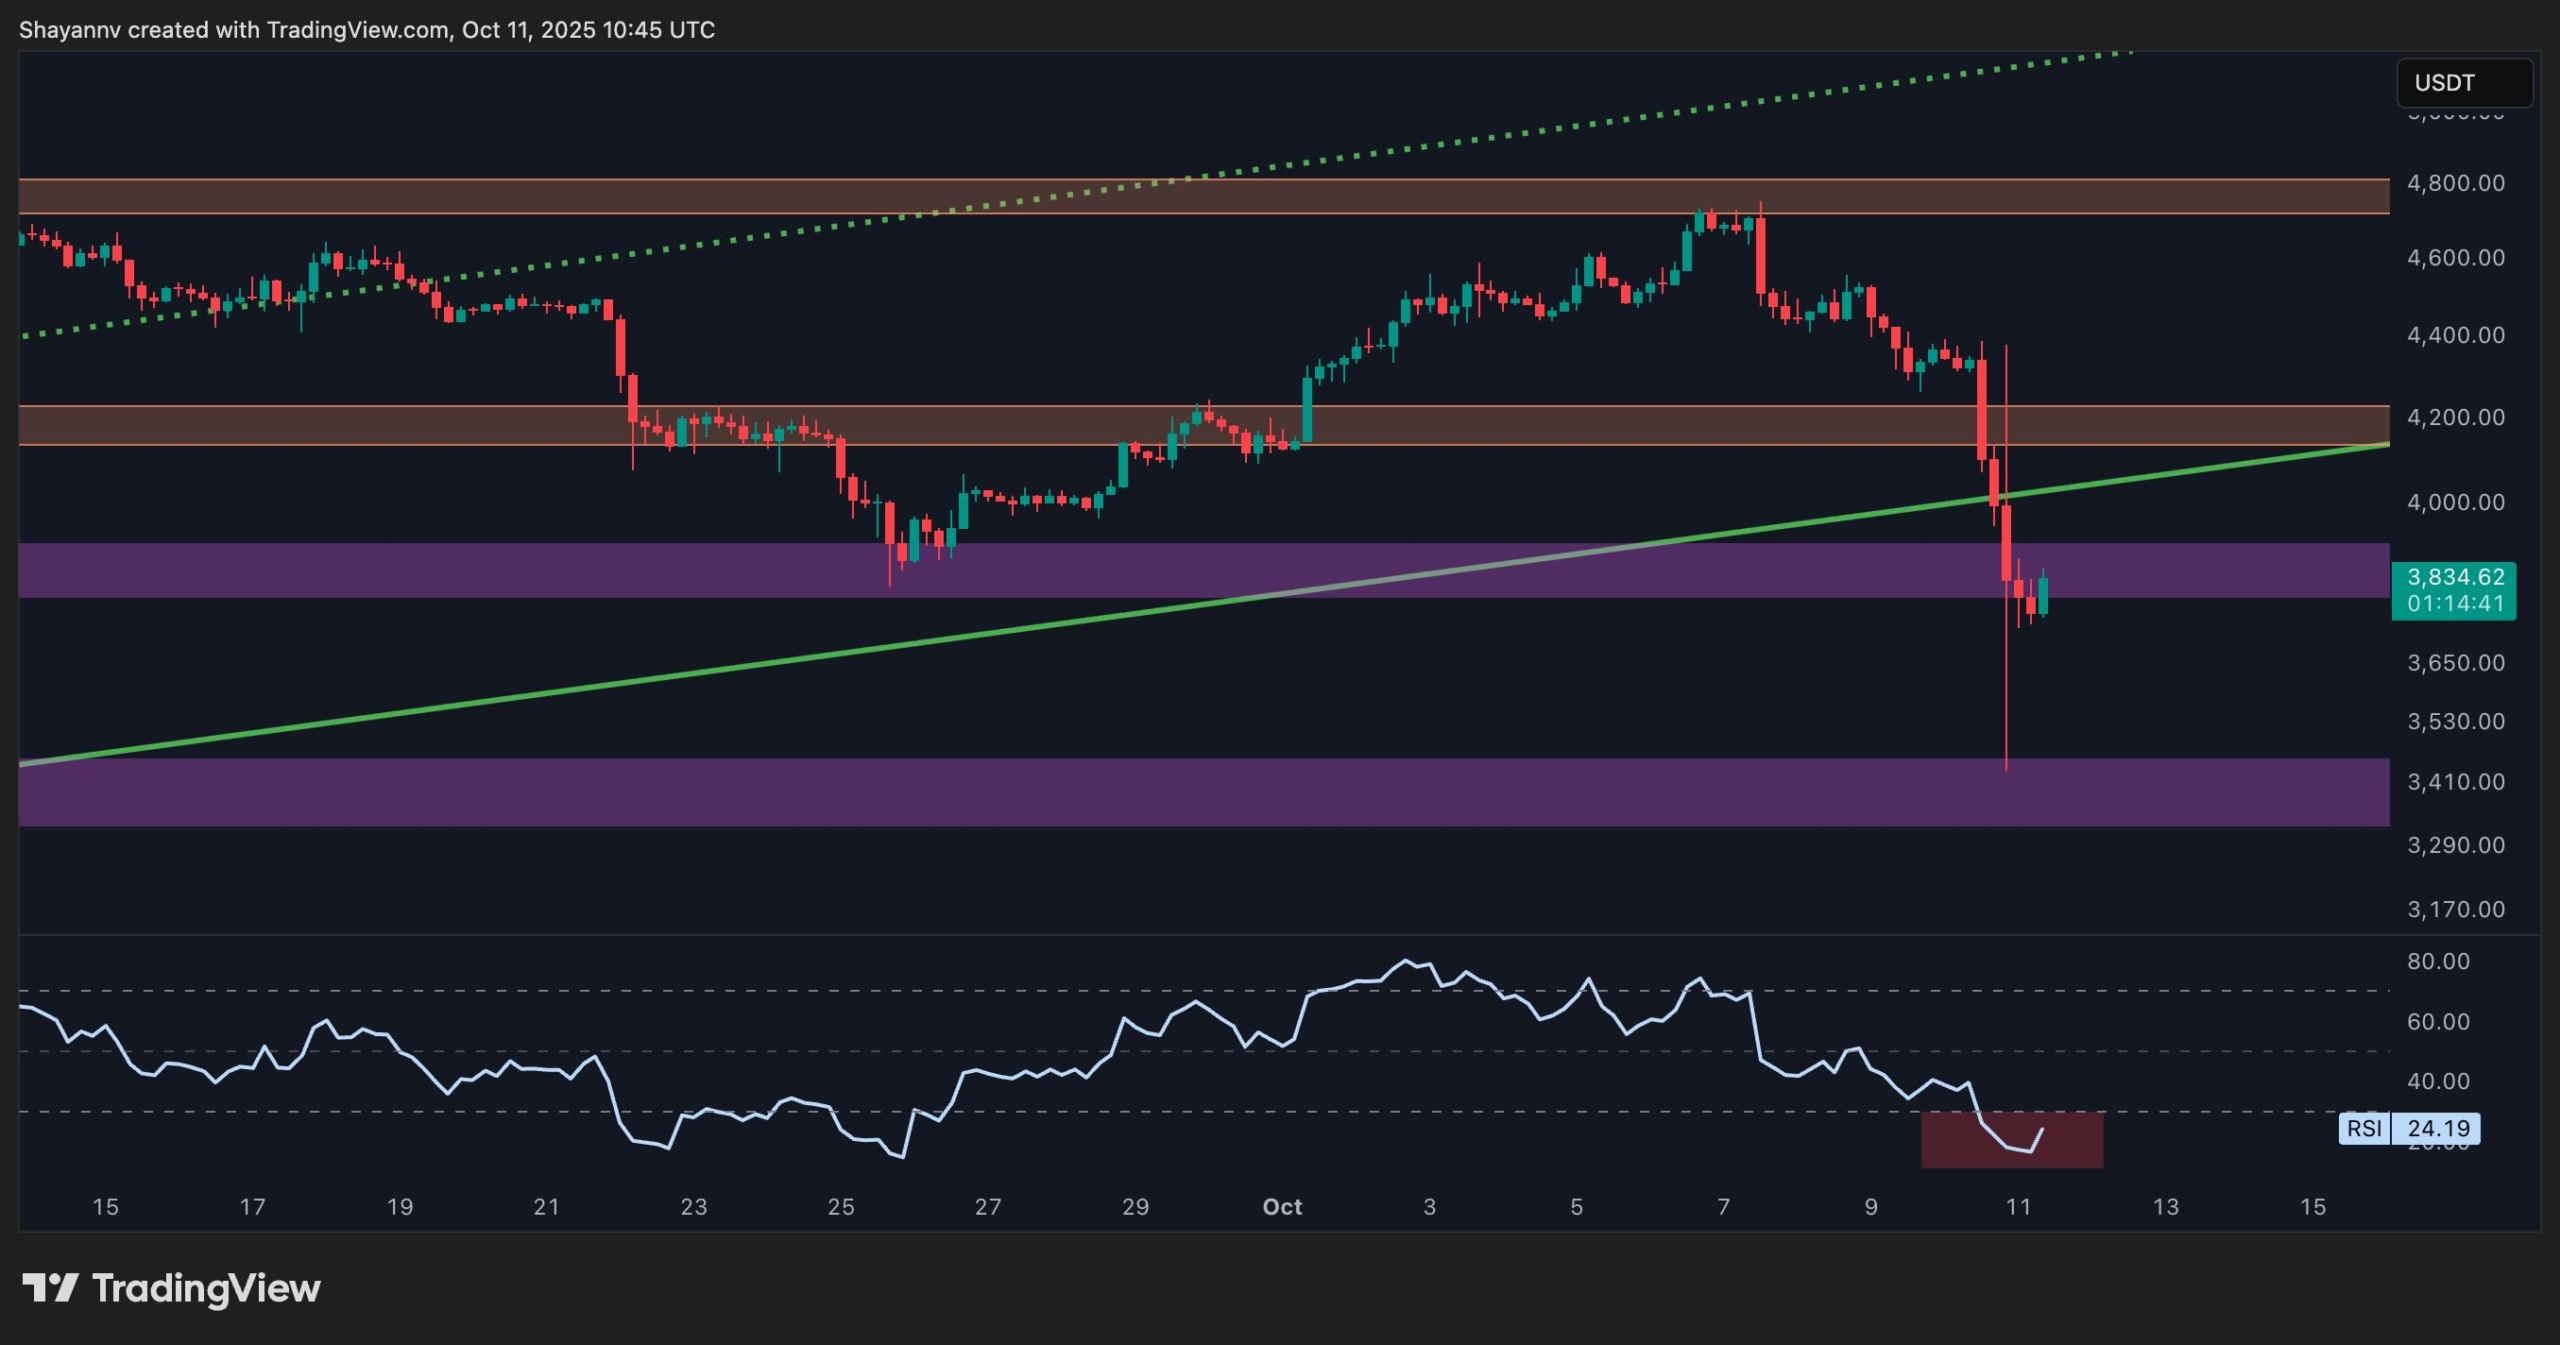
4 hour chart
The 4-hour chart reveals that Ethereum found temporary support within the $3,400 demand zone after plummeting. The RSI has also fallen into oversold territory and is currently near 24, indicating a possible short-term reversal.
Still, the $3,800 resistance remains significant. A rejection there could lead to a retest of $3,400, but a clean breakout could open the way to $4,200 again.
On-chain analysis
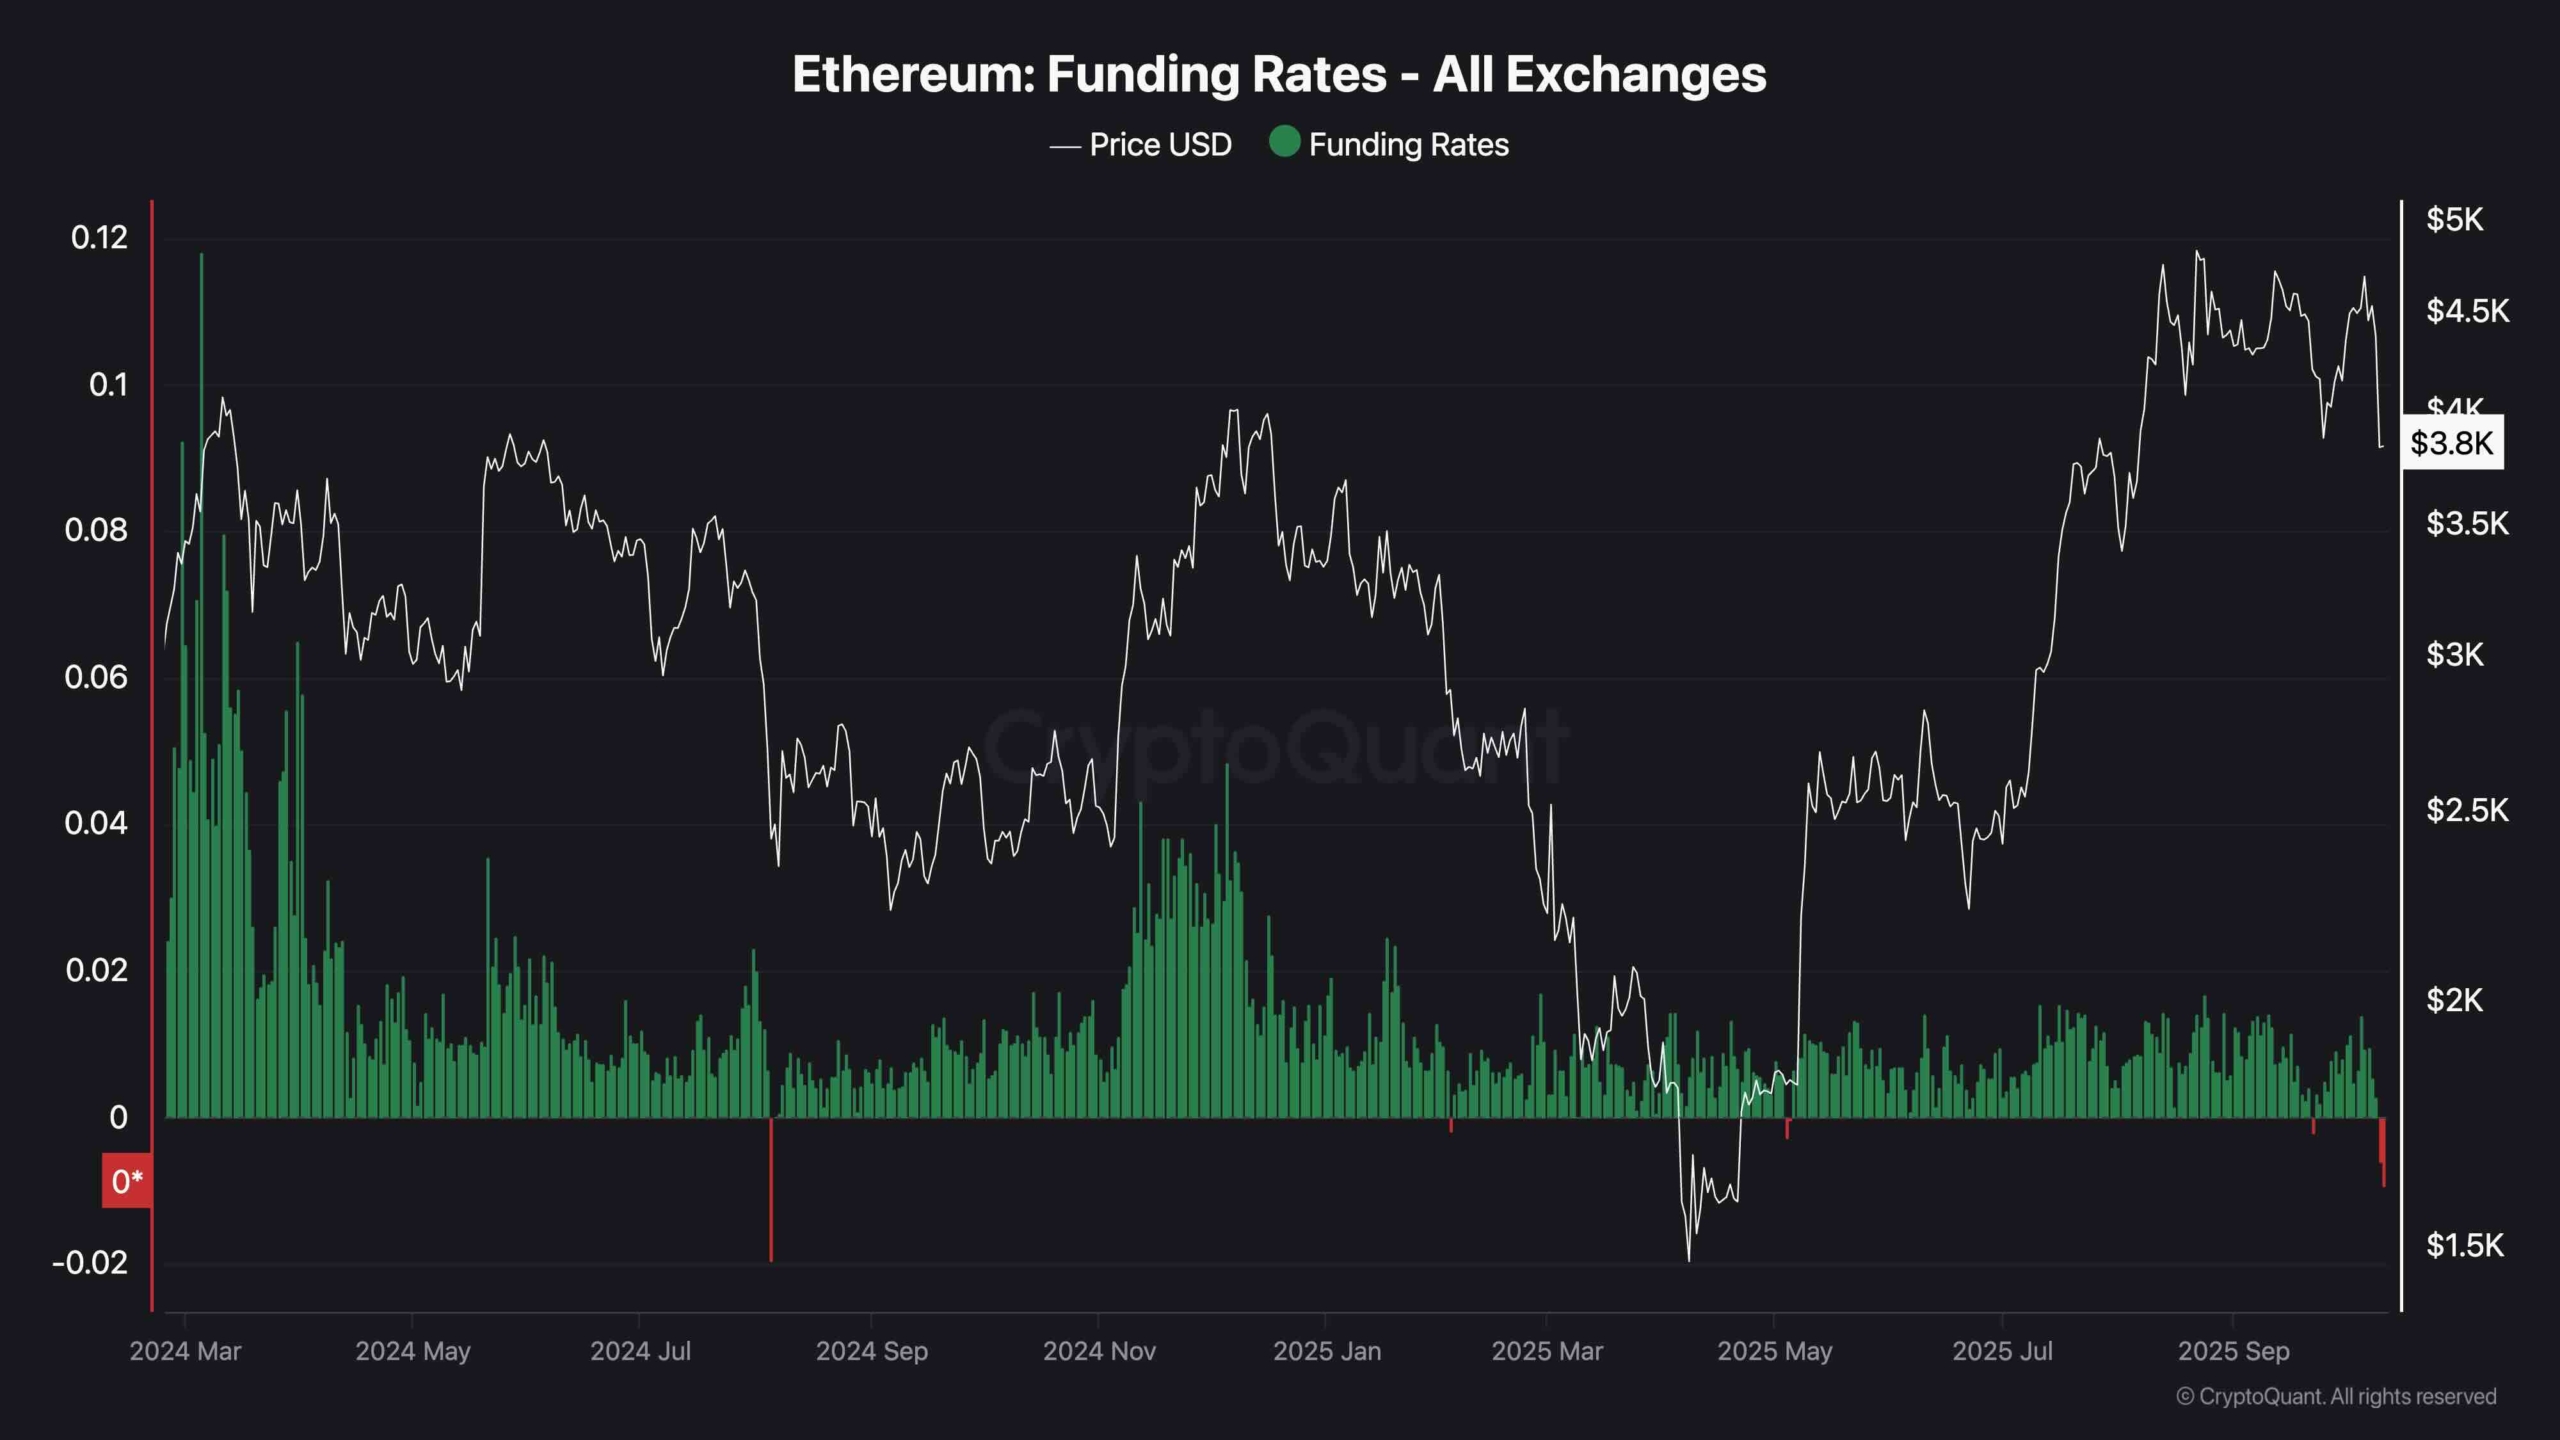
funding rate
As traders rushed to unwind their long positions, funding rates at exchanges fell into negative territory, hitting their lowest level since the end of 2024. This reset is indicative of fear and liquidation pressure, but could also signal a potential bottom if bearish sentiment persists before prices stabilize. Historically, negative funding rates during large pullbacks have preceded short-term recoveries as selling momentum wanes.
So, while the market may be in the early stages of a bearish reversal, there is still hope that this move is just a flashout to cool down the futures market and could pave the way for a sustainable spot-led rally.