

Ethereum continues to trade under heavy pressure as the market struggles to regain momentum after weeks of steady decline. The asset is trading around the $3,060 to $3,080 area, which is currently acting as the main short-term support.
In addition to this immediate zone, traders are watching for structural weakness forming on lower time frames. The 4-hour chart shows repeated failures with decreasing resistance, consistent sell signals, and sustained trades below the 9-EMA. As a result, market sentiment remains defensive as Ethereum attempts to stabilize near current levels.
Market structure reflects sustained bearish dominance
Ethereum maintains a clear pattern of highs and lows. Any rebound attempt quickly evaporates as sellers gain the upper hand after each recovery. Price action remains trapped within the downtrend that has been leading to a downtrend for several weeks.
Additionally, the $3,200 to $3,250 area is the first major hurdle. This zone coincides with SuperTrend resistance and caps multiple recovery attempts. Beyond that, the 23.6% Fibonacci level of $3,373 is the key axis.
Price has struggled at this point throughout the month, reinforcing the importance of price to trend reversals. Additionally, higher resistance near $3,637 continues to limit a stronger breakout.
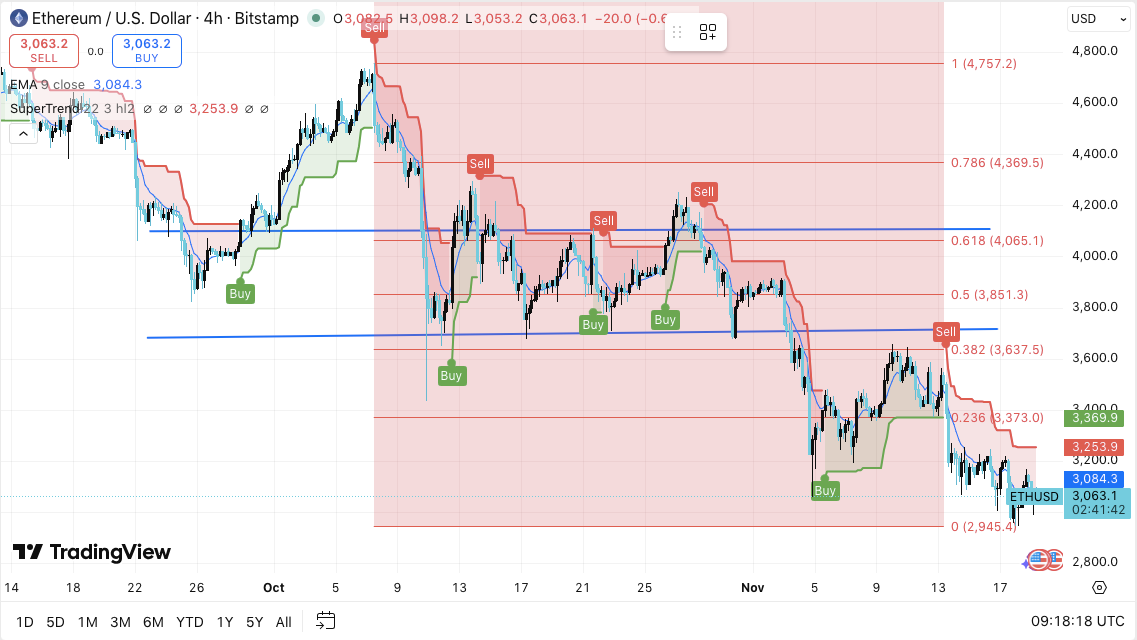
ETH price dynamics (Source: TradingView)
The immediate concern is the $3,060-$3,080 support area. A clear breakdown below this area reveals a 0% Fibonacci level at $2,945. This point represents the lowest swing level in the current structure. Therefore, losing this area could accelerate the downward movement.
Derivatives data shows strong participation despite pushback
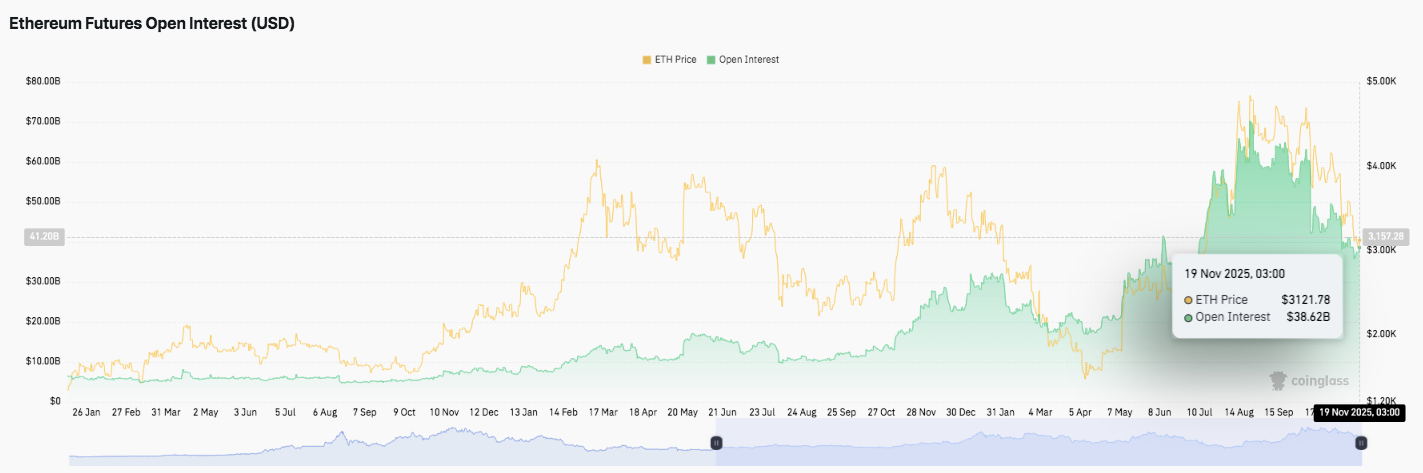
Source: Coin Glass
Despite continued volatility, open interest in Ethereum futures remains high. Open interest rose sharply from late July to September. Levels peaked above $40 billion as leveraged activity increased. Additionally, traders maintained their positions during the recent selloff.
Related: PI Price Prediction: PI Price Remains Medium as Traders Track Upcoming Unlocks
As of November 19, open interest was $38.62 billion and the price was trading around $3,121. This trend suggests that speculative involvement remains strong. Market participants continue to position for the upcoming move despite the broader correction environment.
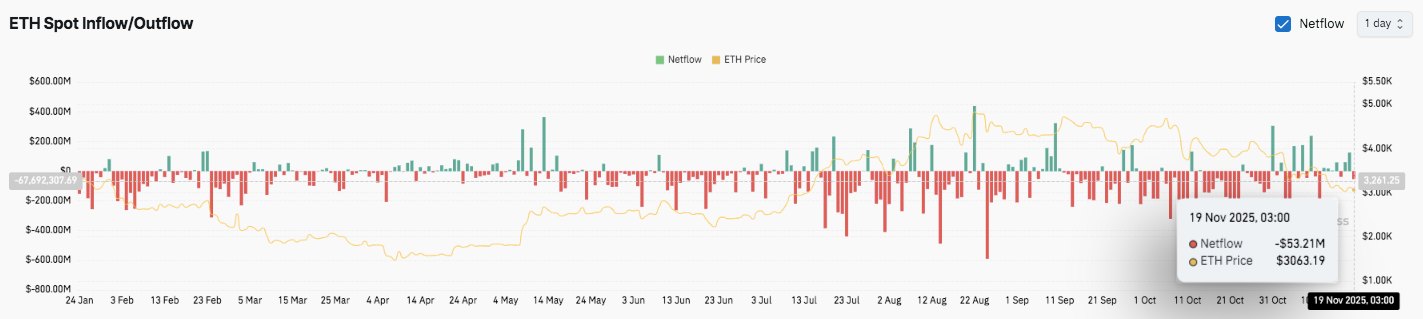
Source: Coin Glass
In addition to futures trading, spot flows also reflect cautious sentiment. Outflows dominated the trend from August to November, often coinciding with price declines.
The latest readings show a net outflow of $53.21 million. This pattern indicates distribution by large holders. However, occasional spikes in influx led to short-term stability, suggesting the possibility of selective accumulation.
Ethereum community considers long-term protocol changes
Apart from price trends, the debate surrounding Ethereum’s long-term safety continues to grow. Vitalik Buterin recently highlighted the need to upgrade quantum performance within four years. He also encouraged the transition to ossification of core protocol features.
Therefore, innovation is likely to increasingly move towards layer 2 networks, wallets, and privacy tools. This direction brings new discussions about Ethereum's evolution as the network prepares for future technological challenges.
Technical outlook for Ethereum price
Ethereum’s key levels remain well-defined as the asset trades within a persistent downward structure.
Upside levels include $3,200, $3,250, and $3,373, which pose immediate hurdles to any attempt at recovery. A breakout above $3,373 could extend to $3,637, where the 38.2% Fibonacci level was the upper bound for the previous reversal.
The downside zone is equally important. The $3,060 to $3,080 band acts as short-term support, while the breakdown reveals a $2,945 level that coincides with the current swing low and 0% Fibonacci marker. This area represents the strongest structural bed on the chart.
Price action shows that Ethereum is trading within a steady downward channel, with lower highs and lower lows guiding the momentum. A supertrend sell signal and sustained rejection at the 9-EMA strengthens the bearish environment. Therefore, ETH continues to compress towards the lower bound of the pattern, and a decisive move could cause significant volatility expansion in either direction.
Will Ethereum hold this zone?
Ethereum’s near-term direction will depend on whether buyers can defend the $3,060 support pocket long enough to challenge the $3,200 to $3,250 zone. Sustained inflows and a recovery of the 9-EMA will strengthen the bullish attempt towards $3,373 and $3,637. Additionally, rising open interest suggests strong participation and could amplify the move once price breaks out of the channel.
Related: Starknet Price Prediction: STRK Remains in Breakout Zone as Buyers React to $3M Spot Inflow
However, failure to hold $3,060 risks ETH being pulled towards a broader accumulation base at $2,945. When it collapses, the structure becomes even weaker and can promote deeper orthodontic pressure. For now, Ethereum is trading at a pivotal point. Market flow and trend confirmation will continue to be the determining factor for the next meaningful leg.
Disclaimer: The information contained in this article is for informational and educational purposes only. This article does not constitute financial advice or advice of any kind. Coin Edition is not responsible for any losses incurred as a result of the use of the content, products, or services mentioned. We encourage our readers to do their due diligence before taking any action related to our company.