

Ethereum price has fallen over 6% in the past 24 hours and is currently down about 27% in the past 30 days. The break from the main continuation pattern opened the door to an even deeper decline. At the same time, on-chain signals are flashing a 28% downside window that could be Ethereum’s next cycle bottom if conditions worsen.
Taken together, these signals suggest that the ETH correction may not be complete yet.
Do certain long-term indicators indicate room for decline?
Ethereum recently collapsed from a clean bear flag. The move began after ETH failed at $2,990, breaking out of the ascending channel it had been trading in less than a week. The initial decline created a “pole” with a 28.39% decline, and this breakdown activates a measured target near $2,140, almost exactly 28% below the breakdown level.
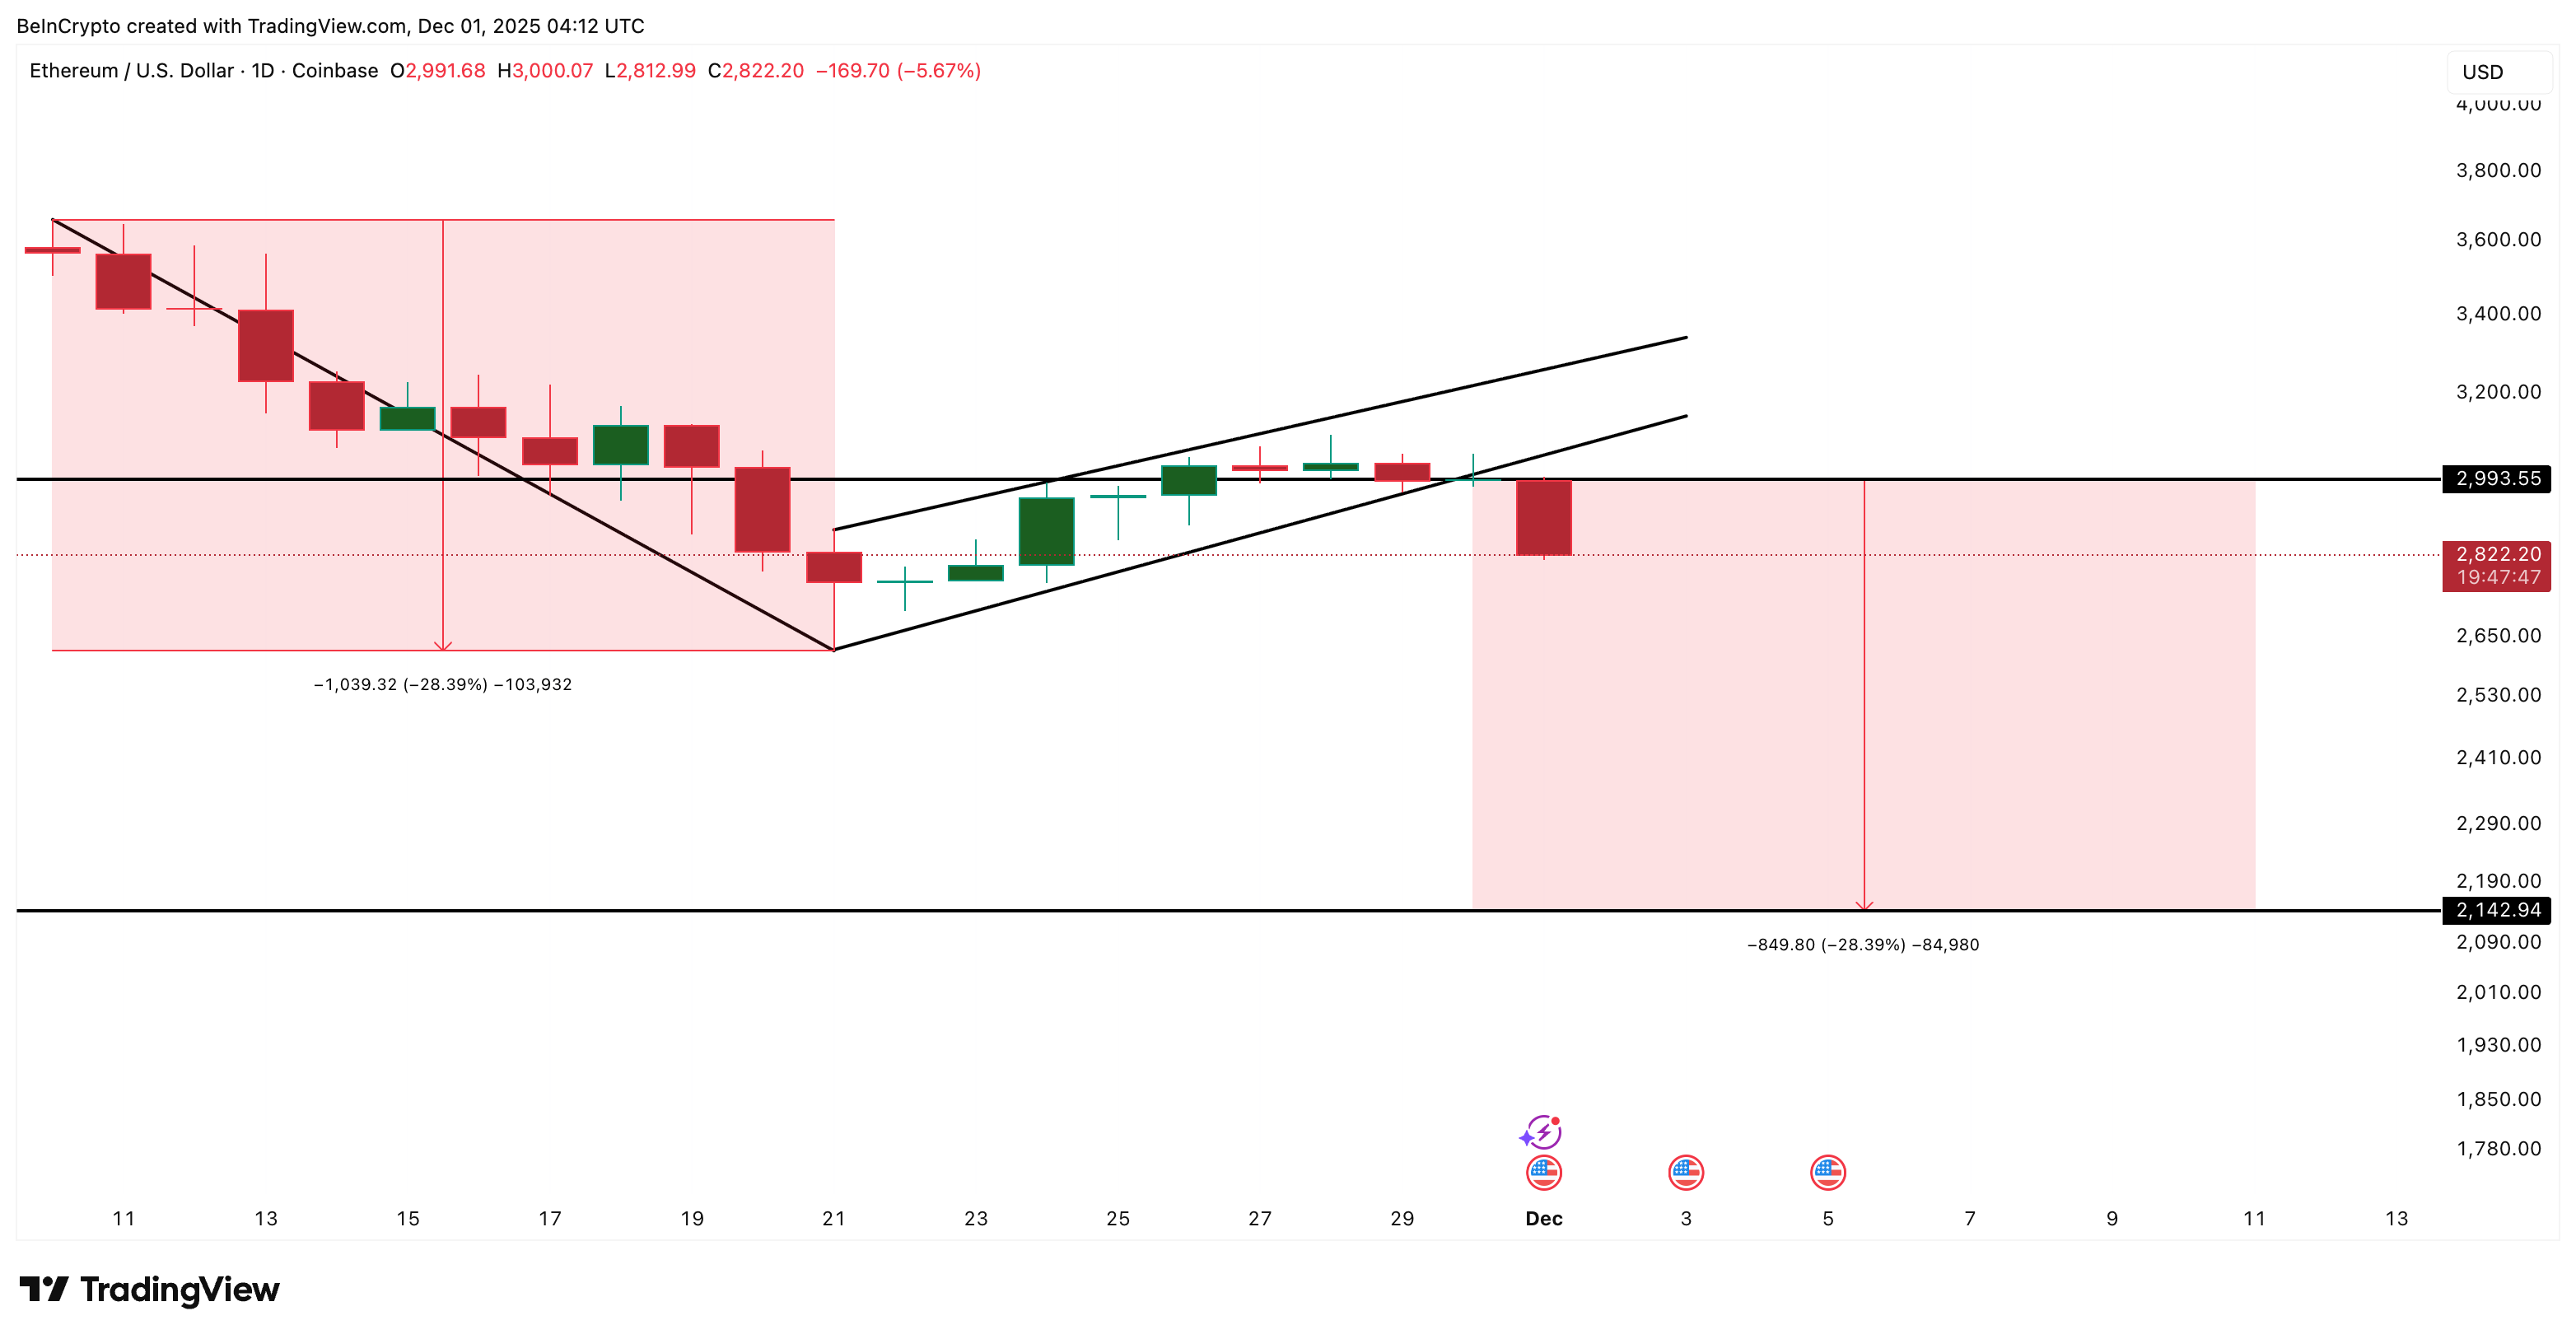
Ethereum Breakdown: TradingView
Want more token insights like this? Sign up for Editor Harsh Notariya’s Daily Crypto Newsletter here.
To see if this goal makes sense, let's compare it to long-term holder NUPL. Long Term Holders NUPL measures how much profit long term holders are making.
NUPL has been trending lower since August 22nd, suggesting long-term holders are reducing unrealized gains and tempering confidence. The most recent short-term low was 0.36 on November 21st, while the six-month low was 0.28 recorded on June 22nd, a difference of about 22%.
On June 22nd, when NUPL reached 0.28, ETH traded around $2,230, causing a sharp market reversal. From there, Ethereum rose to $4,820, an increase of 116% from its bottom.

Formation of a new bottom zone: Glassnode
If NUPL retests its 0.28 cycle low band again today, the implied price drawdown from ETH's recent local high around $2,990 would be in the same 20-25% range, exactly matching the 28% bear flag target of $2,140.
This is the clearest overlap in the entire analysis. Both the price pattern and long-term holder indicators point to the same lower zone.
Ethereum price is on the strongest wall on a cost basis
The next step is to see if the Ethereum price chart supports the same conclusion. A cost-based distribution heatmap shows where large ETH clusters have recently accumulated. The heaviest band is between $2,801 and $2,823, with 3,591,002 ETH purchased in that zone. This is the strongest support Ethereum currently has.
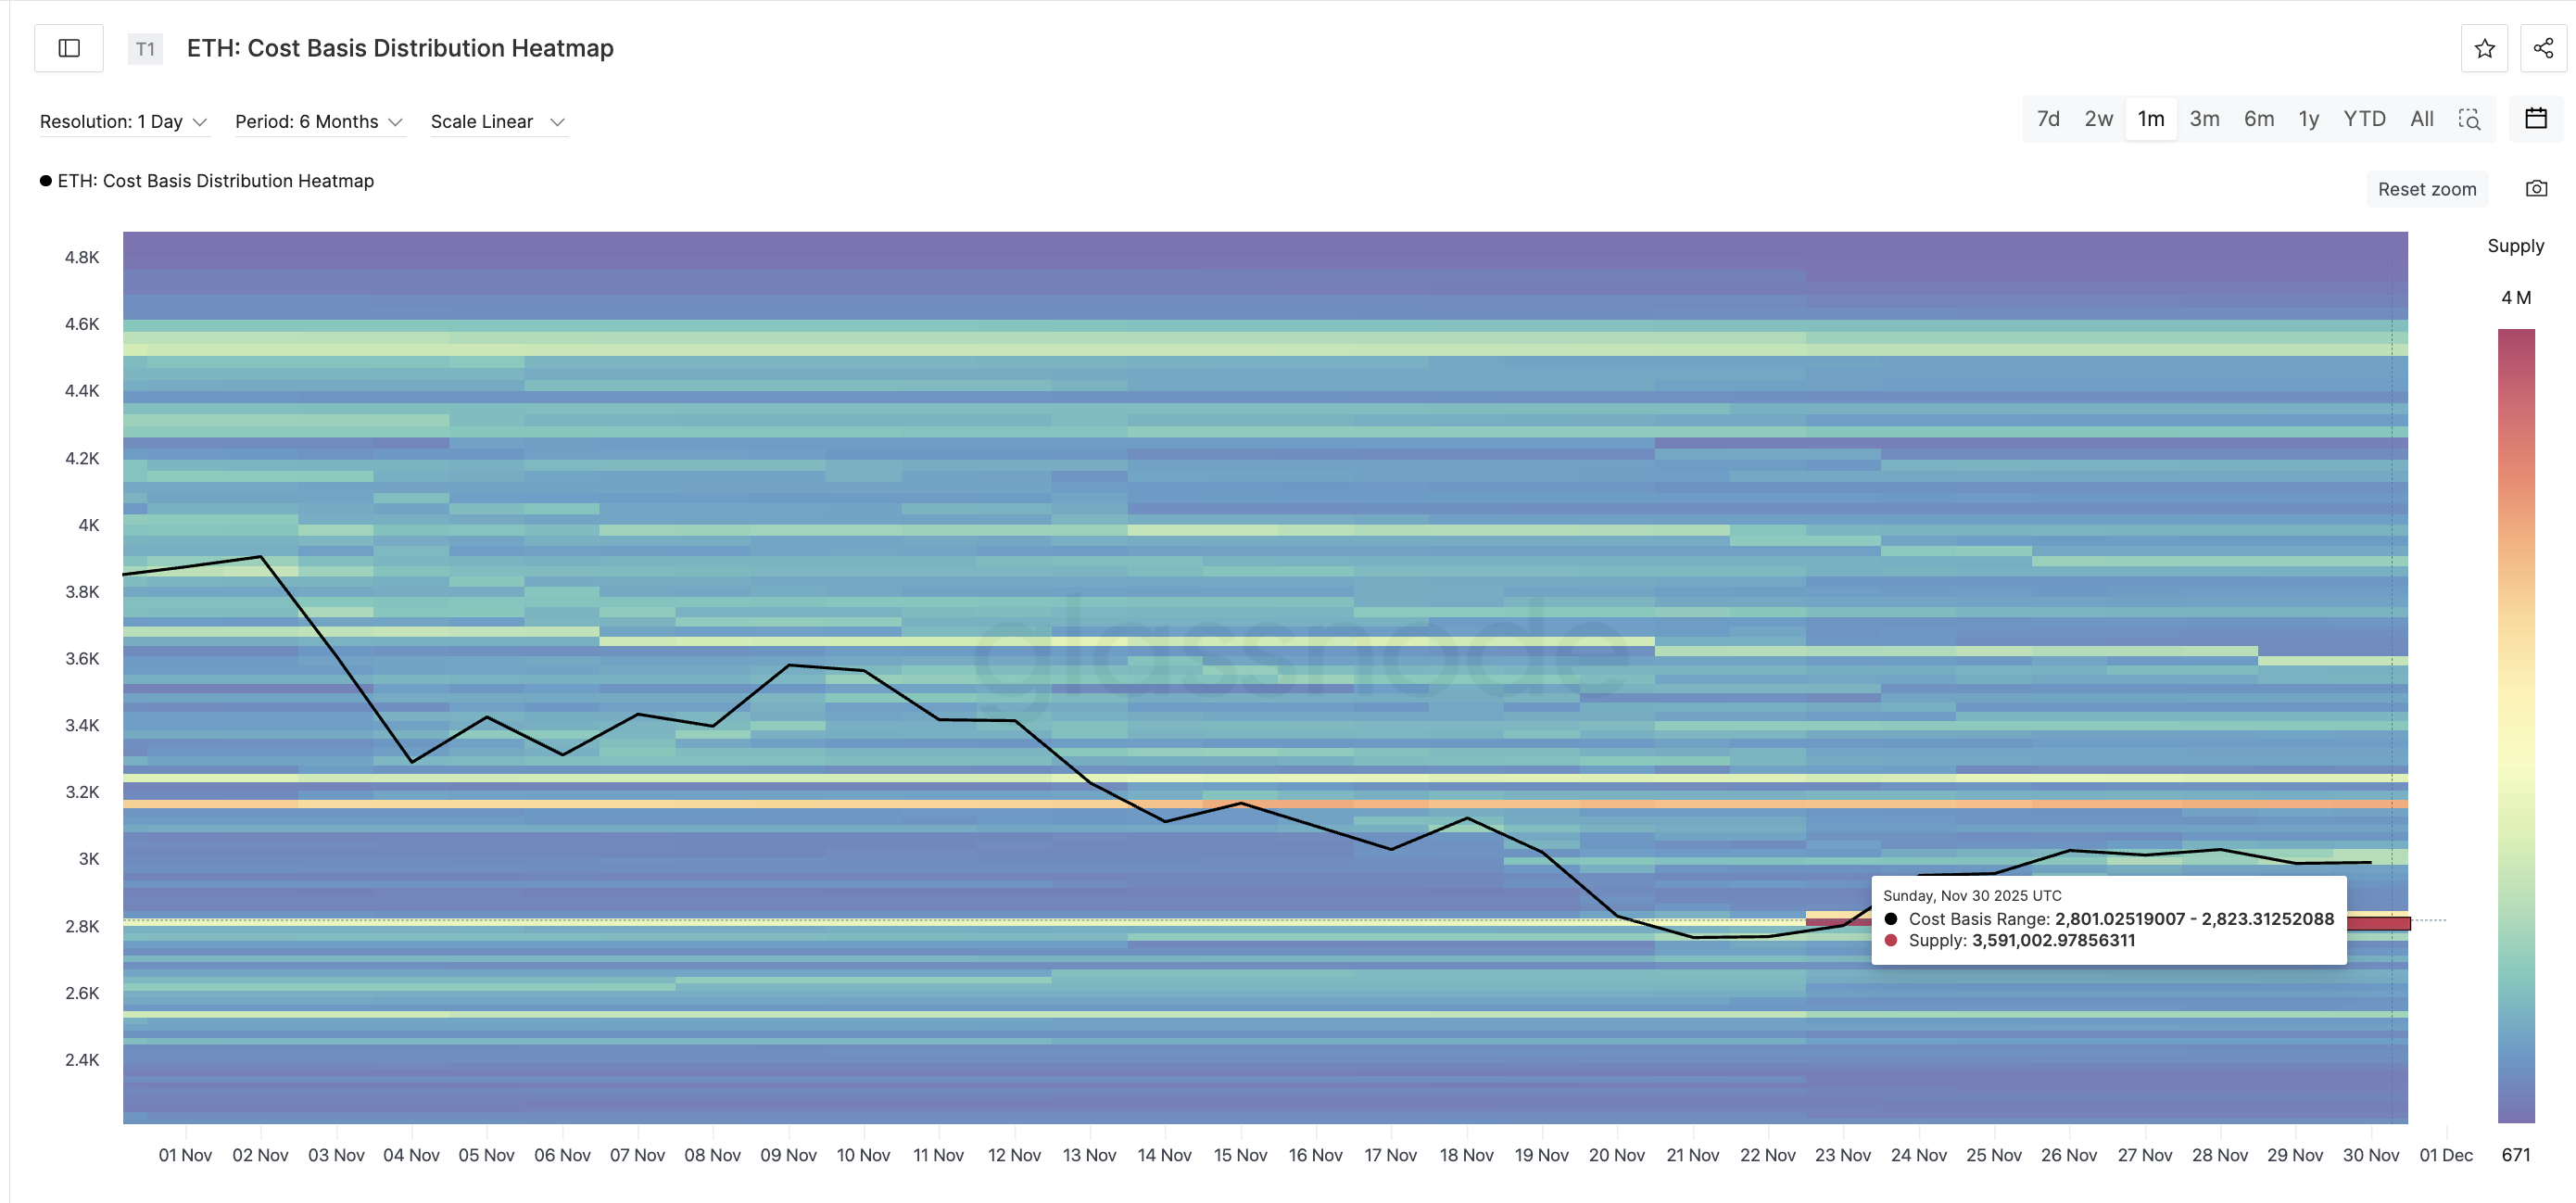
Last supply wall: Glassnode
ETH has already fallen below the $2,840 price level, increasing pressure on this cost-based wall. Sellers remain in full control even if ETH price is unable to recover $2,840 quickly and close above $2,990 again.
As the weakness continues, the next level of trend-based extensions emerge one after the other. The first point is $2,690, about 4.5% less than the current price. If that fails, the decline could widen to $2,560 (a further 4.6% decline), $2,440 (another 4.8%), and $2,260, just 2% above June's NUPL bottom of $2,230.
Beneath all of this is a full breakdown target of $2,140, about 28% below the breakdown zone and perfectly in line with the flag's prediction.
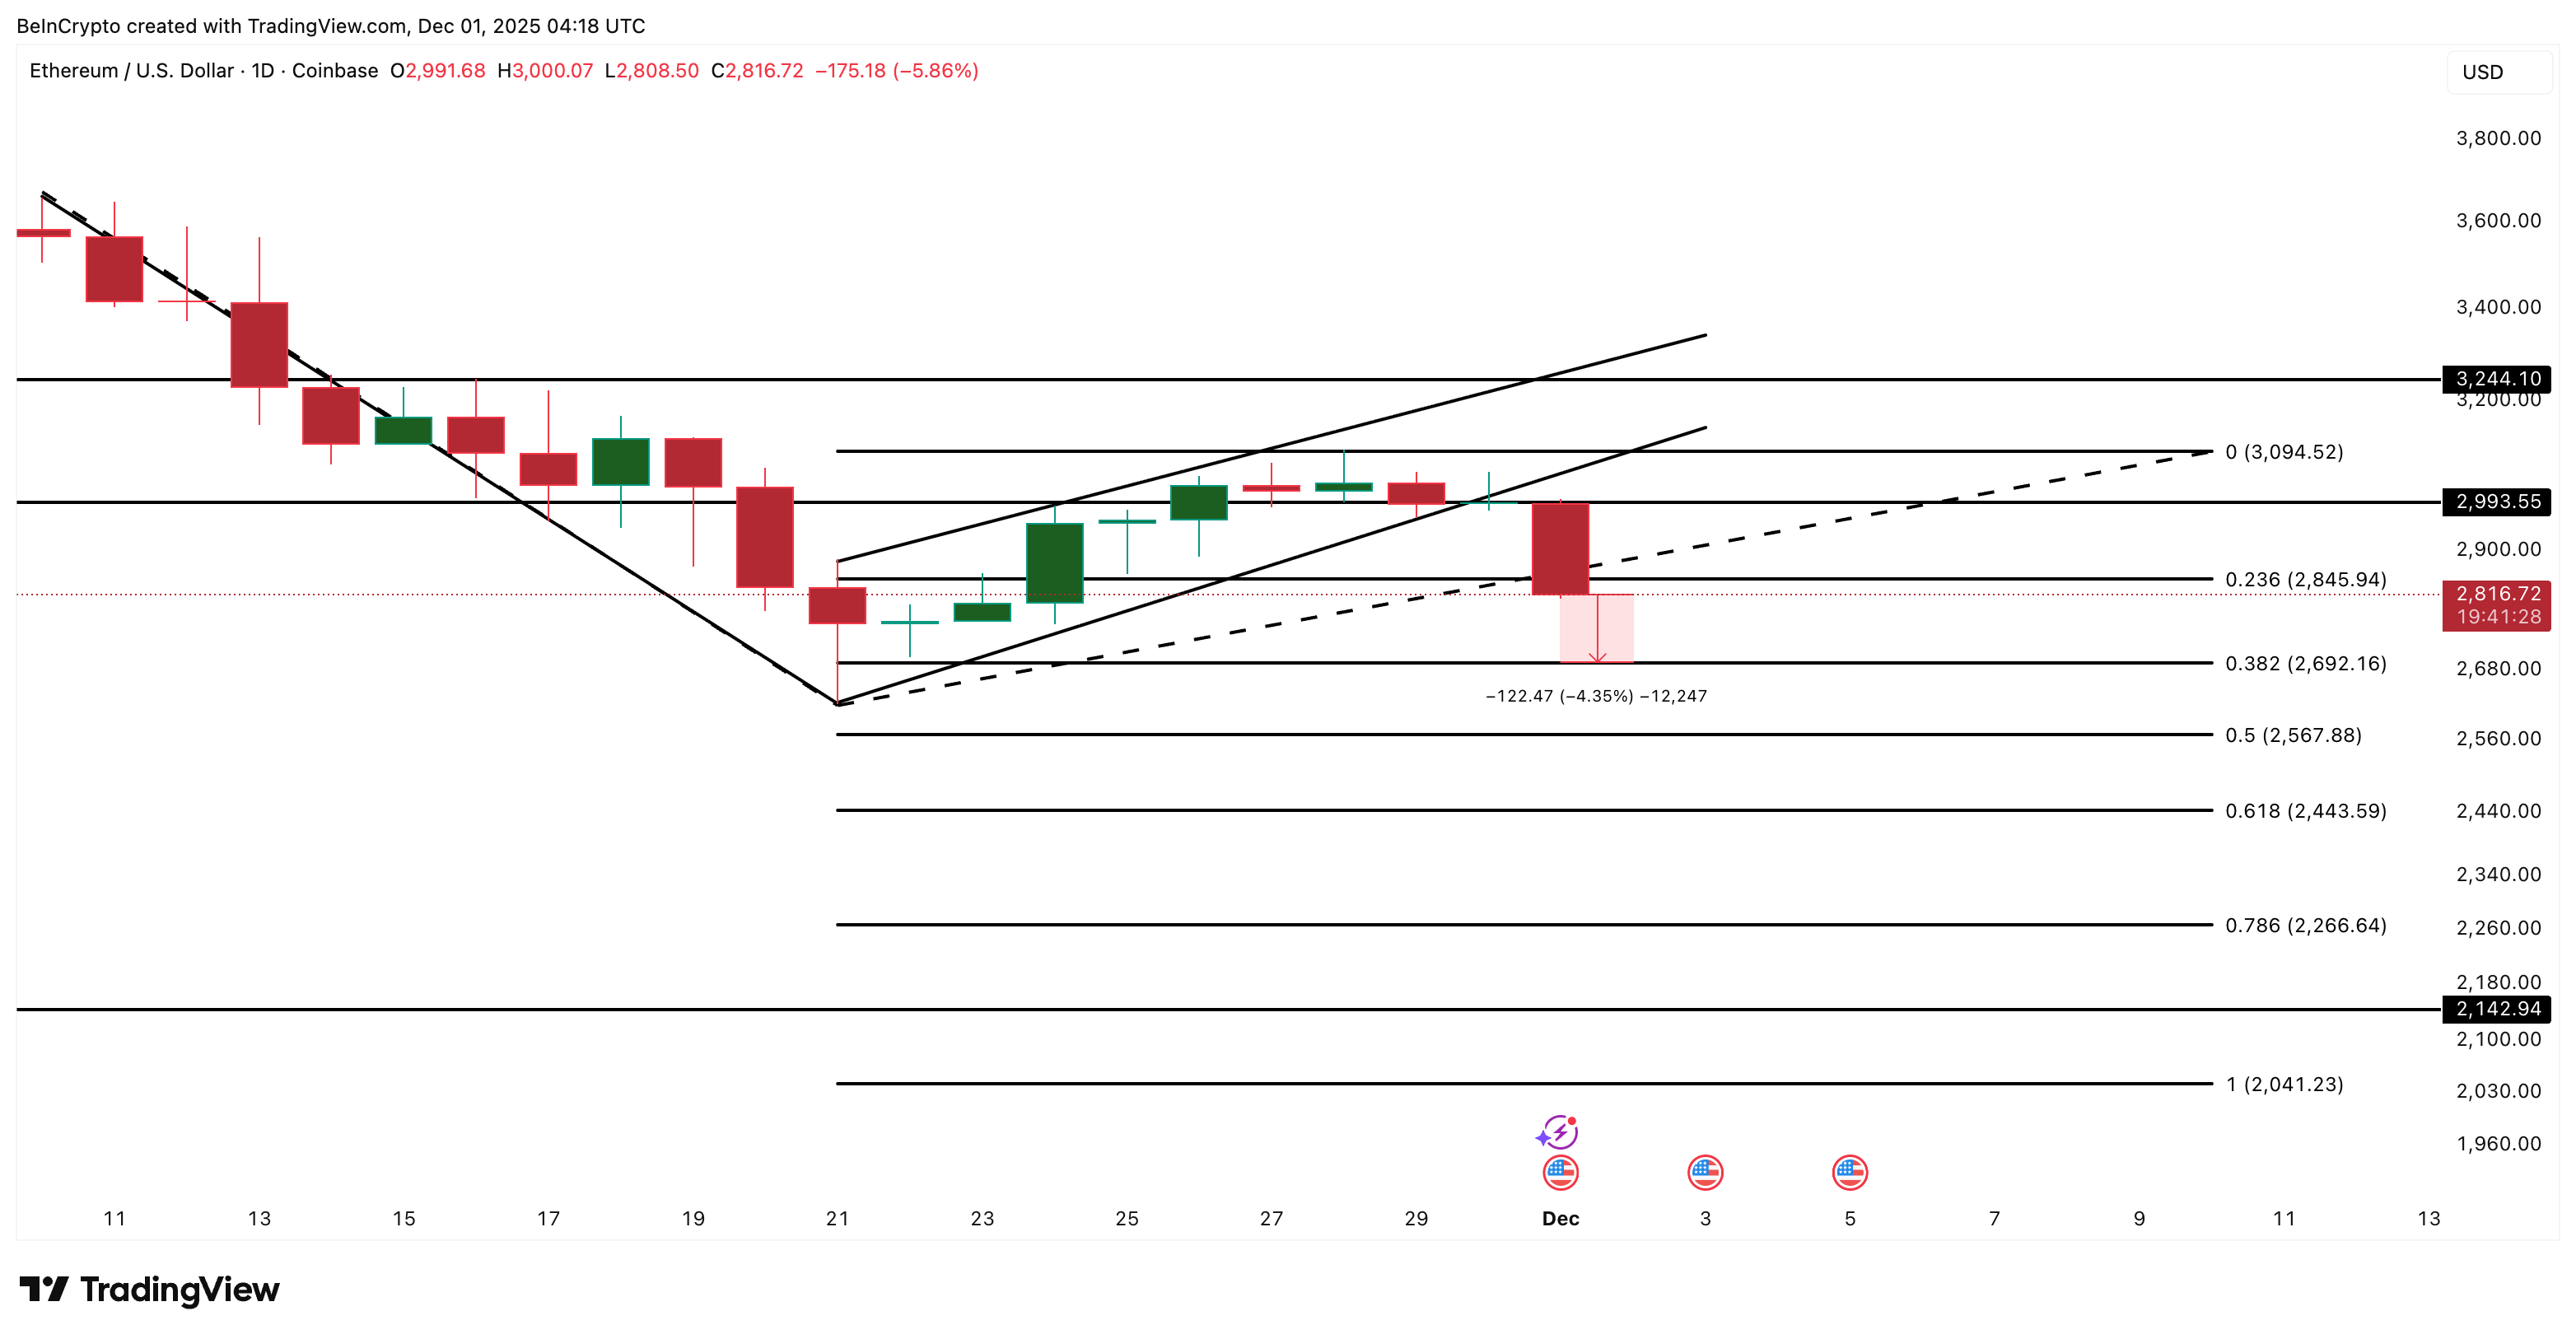
Ethereum Price Analysis: TradingView
If ETH falls below $2,266, a bear flag target becomes the most realistic scenario.
There is still a nullification path, but it requires several layers of strength. ETH needs to regain $2,840, then break above $2,990, and then secure a close above $3,090. The overall bearish pattern will only lose meaning if ETH breaks through $3,240, which is about a 15% increase from current levels.
For now, ETH is trading under the strongest cost-based wall, long-term holders are still reducing unrealized gains, and the continuation structure is clearly declining. If these conditions hold true, the $2,260-$2,140 area is where Ethereum is most likely to form its next cycle bottom.
The article Ethereum breaks down from major pattern, paving the way for 28% crash appeared first on BeInCrypto.