

The Ethereum network is in its most active phase to date. However, this does not necessarily indicate a bullish outlook. Recent on-chain data shows that Ethereum has reached a major milestone, with the number of transfers reaching an all-time high. Historically, similar signals have not always resulted in positive price performance.
Moreover, a surge in currency inflows has raised concerns that selling pressure has not yet subsided.
How does Ethereum's current situation compare to 2018 and 2021?
Entering February, CryptoQuant data shows that Ethereum transfers (total number of token transfers), measured on a 14-day moving average, reached a record level of 1.1 million.
At first glance, these numbers look promising. This suggests strong growth for the network and widespread adoption of Ethereum.
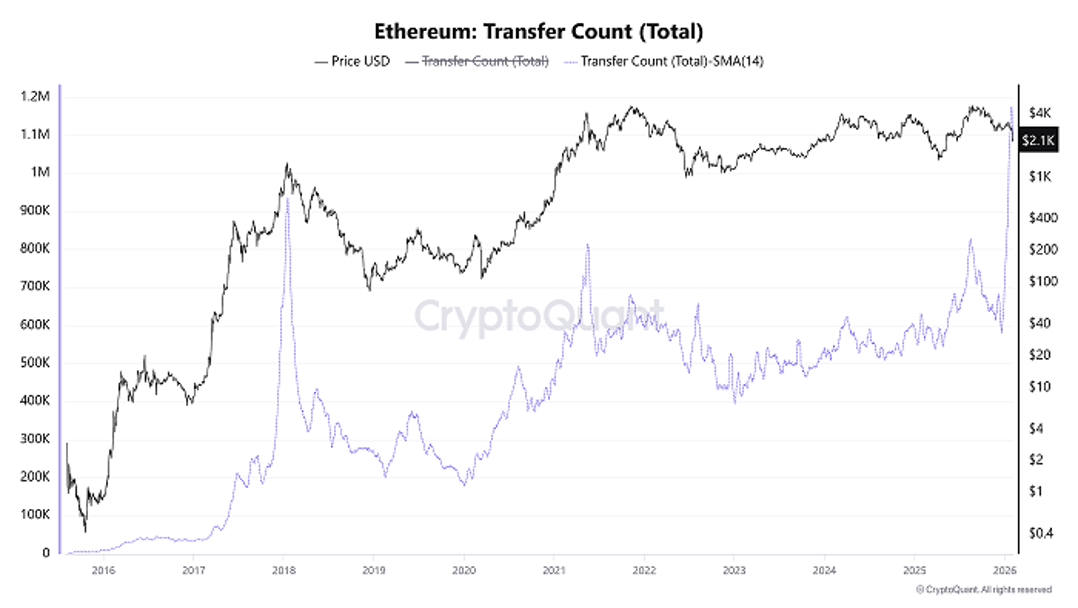
Number of Ethereum transfers. Source: CryptoQuant.
However, deeper analysis shows that this may not be the bullish signal many expected. Rather, it may indicate a correction phase or even a cyclical price peak based on historical precedent.
CryptoQuant analyst CryptoOnchain highlights two periods when heightened Ethereum network activity was hinting at a market top.
- On January 18, 2018, at the peak of the ICO boom, the number of Ethereum transactions skyrocketed. Immediately thereafter, $ETH By the end of the year, it had fallen from about $1,400 to less than $100. This decline plunged the entire cryptocurrency market into a two-year “crypto winter.”
- On May 19, 2021, this indicator reached a new record high amid the explosive growth of DeFi and NFTs. Then the market reversed sharply, $ETH It fell from more than $4,000 to less than $2,000.
The reasoning is easy. increased $ETH This movement indicates that more investors are withdrawing funds from their wallets, often in large transactions. This behavior may reflect an attempt to sell due to deteriorating future expectations.
“The current scenario is very similar to the setup seen in 2018 and 2021. While the macro environment is changing, the on-chain behavior of network participants suggests that we are in a high-risk zone,” CryptoOnchain said.
This view is further supported by the surge in Ethereum transaction inflows (top 10). $ETH It fell below $2,300 in early February.
Ethereum Exchange Inflows (Top 10) measures the total amount of coins from the 10 largest inflow transactions to an exchange. A high value indicates that more investors are depositing large amounts of money at once. This often indicates increased selling pressure and the risk of further price declines.
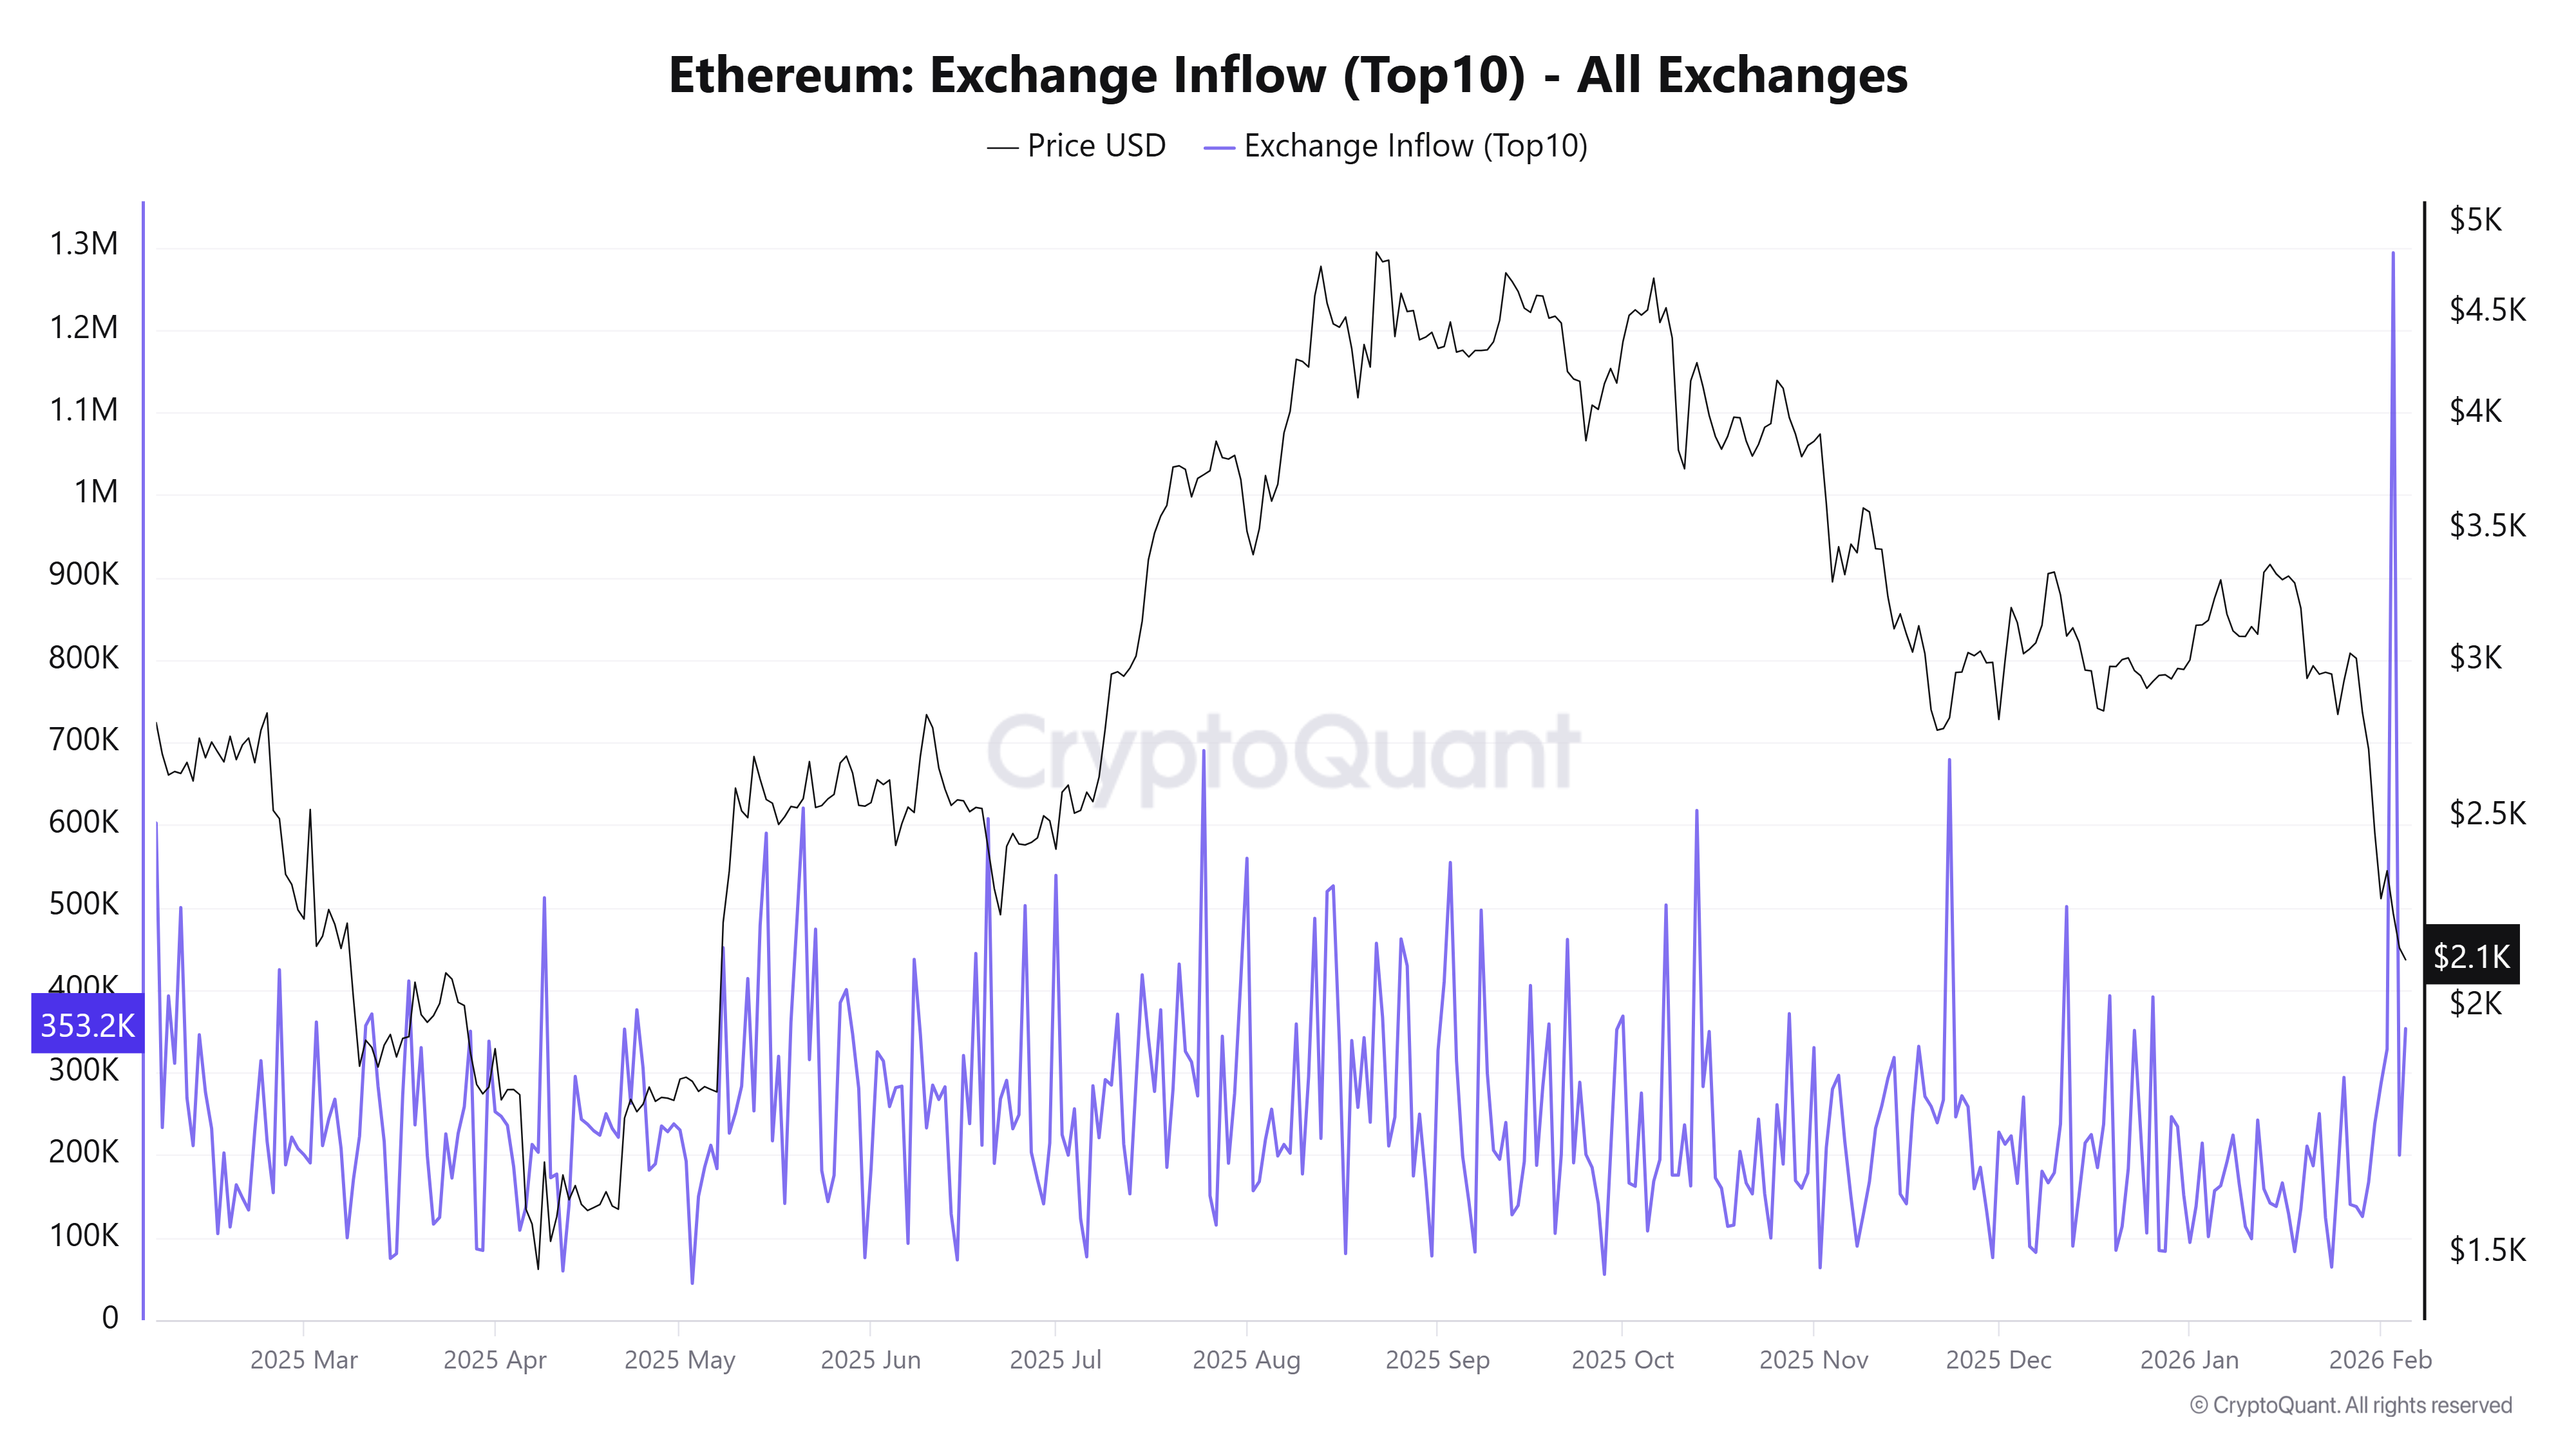
Ethereum Exchange Inflow (Top 10). Source: CryptoQuant.
On February 3, the metric jumped to 1.3 million people, the highest level in a year. 2 days later $ETH It fell from $2,230 to less than $2,100.
According to BeInCrypto analysis, Ethereum needs to recover to at least $3,000 for a trend reversal to be confirmed. In the short term, $ETH As the selling pressure remains unresolved, the pair may continue to fall towards the $2,000 support level.
The article “Ethereum network activity has peaked, but why this is not necessarily a bullish signal” appeared first on BeInCrypto.