

- The evening star candle pattern on the resistance trend line of the descending wedge pattern indicates a possible decline in the Ethereum price.
- The 1,000-10,000 ETH cohort had the heaviest selling at its peak and continues to distribute coins in the current market.
- If the slopes of the 100-day and 200-day EMAs can cross the dead line, selling pressure in the market may accelerate.
ETH, the native cryptocurrency of the Ethereum blockchain, fell more than 3.5% during US market hours on Friday, trading at just over $2,000. The broader crypto market has shown a similar decline, appearing to regain some of the bearish momentum worn out in the early weeks. However, the Ethereum price faced further selling pressure as mid-sized whales (1,000-10,000 ETH) placed large volumes in circulation. Will the top altcoin lose $3,000 again?
Mid-tier Ethereum whale causes post-peak selling pressure
Over the past three months, Ethereum price has steadily declined from its all-time high of $4,955 (ATH) to its current trading price of $3,040, posting a 39% loss.
On-chain data on Ethereum’s supply distribution shows that holders with balances of 1,000 to 10,000 ETH accounted for the majority of sales in recent ATHs. The group aggressively sold positions at the peak of the price, amid optimism among other market participants celebrating new highs.
The same bracket continues to reduce its holdings at this time, creating more sustained downward pressure even as the price attempts to stabilize above $4,000. Daily net outflows from these addresses remain above pre-rise levels.
On the other hand, addresses with more than 10,000 ETH show much lower activity. Their combined balances have only declined slightly from their highs, and there is no sign that the sell-off will accelerate or that much will accumulate. Transfers between the largest wallets remain within normal ranges, suggesting a wait-and-see approach rather than aggressive redeployment.
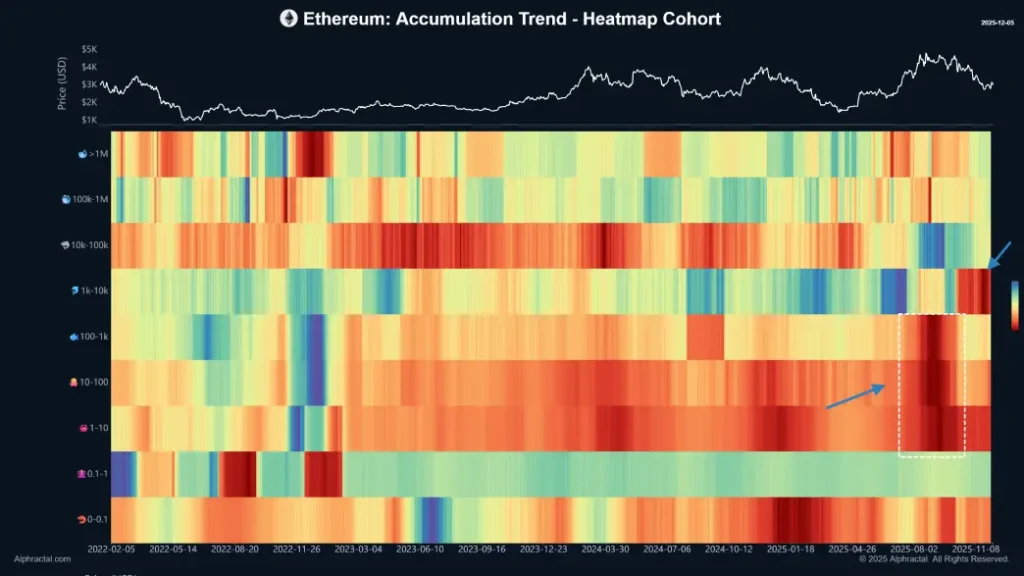
Small holders of less than 1,000 ETH exhibit a variety of behaviors, with some adding to tokens during declines and others trimming their positions, but their combined influence appears small compared to the mid-tier group.
This divergence can be seen in real-time supply measurements. The 1,000-10,000 ETH tier has lost around 4-6% of its total supply since the local peak. Over 10,000 tiers lost less than 0.5% during the same period. This imbalance indicates which segment currently dominates the short-term direction of price movements.
This reversal risks Ethereum price falling by $2,500.
Over the past two days, Ethereum price has shown a bearish decline from $3,240 to the current trading price of $3,022, recording a loss of 4.74%. This downtick shows an Evening Star bearish candlestick pattern at the resistance line of a descending wedge pattern.
The chart setup is characterized by two converging trendlines that provide dynamic resistance and support for coin traders. That downtrend is driving the current price correction while maintaining selling sentiment.
Once the ETH price falls below the slope of the 20-day exponential moving average, sellers are likely to consolidate their group against this asset over the long term. The post-reversal drop could push the price up another 29% and seek support from the $2,115 wedge pattern.
The current price being below the major EMAs (20, 50, 100, 200) emphasizes that the path of least resistance is down.
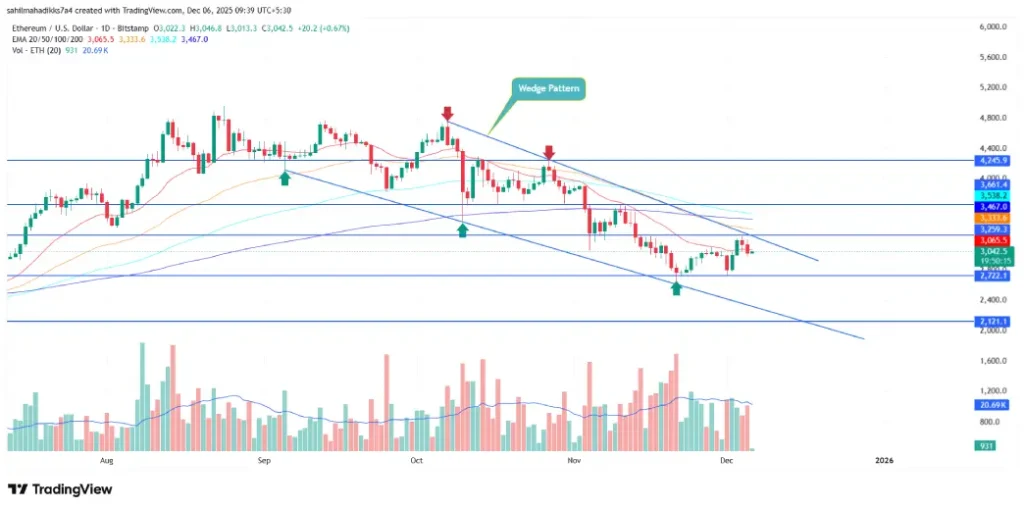
ETH/USDT -1 day chart
Conversely, if buyers turn the overhead resistance into potential support, ETH could regain bullish momentum towards a sustained price recovery. The post-breakout rally could face major resistance at $3,466 and then $4,250.