

Ethereum surpassed the psychologically important $3,000 level, providing brief relief after weeks of pressure and indecision. While this move signals a constructive near-term development, price action is far from the technical threshold needed to completely reset the broader uptrend.
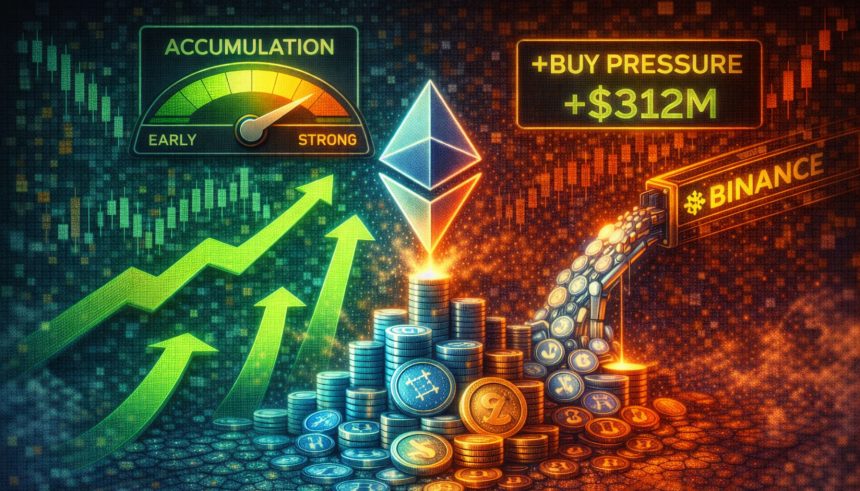
Against this backdrop, on-chain and derivatives data is starting to show subtle but notable changes. The 14-day moving average of Ethereum's Binance buy/sell ratio rose to 1.005, the highest since July, according to CryptoQuant analysis. A ratio higher than 1 means aggressive market buy orders outweigh sell orders, indicating a growing bullish appetite among derivatives traders.
The report explains that ETH remains well below its previous cycle highs. This means that this aggressive increase in buying is not a reaction to strong upward momentum. Instead, it suggests early positioning or accumulation behavior, with market participants entering ahead of potential directional movements rather than chasing price.
However, derivatives-driven optimism alone is not sufficient to confirm a trend reversal. For Ethereum to transition from a recovery to a sustained rally, this improved aggressiveness must be accompanied by stronger spot demand and a decisive recovery of higher resistance levels.
Derivatives Aggressiveness Building, But Verification Still Matters
Our analysis shows that historically, sustained periods of Ethereum's bid/ask ratio above 1 (particularly when reinforced by rising moving averages) have often coincided with phases of increasing bullish volatility or initial attempts at a trend reversal.
This behavior reflects a growing sense of urgency among buyers to execute at market prices rather than wait for a decline, a dynamic typically associated with improving sentiment and changing expectations.

However, this signal comes with an important caveat. The taker buy/sell ratio is primarily a derivatives-focused indicator, and increased buying pressure in leveraged markets does not automatically lead to a durable rally.
Without confirmation from the spot market, including increased spot volume, net exchange outflows, and continued on-chain accumulation, the price reaction from derivatives activity could quickly fade. In the past, there was a brief rally due to highly leveraged positioning, which was later liquidated when actual capital inflows failed to materialize.
Currently, this structure actually suggests that aggressive buying pressure is building within the Ethereum derivatives market. This increases the likelihood of recovery attempts, especially if traders take positions proactively rather than reactively.
Nonetheless, confirmation will depend on price movement above key resistance levels and alignment with broader indicators of spot demand, on-chain activity and overall market liquidity.
Ethereum price faces major test
Ethereum has pushed back above the $3,000 level, providing a short-term relief bounce after weeks of compression and falling highs. But the broader structure remains vulnerable. On the daily chart, ETH is still trading below the declining 100-day and 200-day moving averages, which continue to act as dynamic resistance and define a dominant bearish to neutral trend.

The latest move appears to be a corrective measure rather than an impulsive one. Price action showed shallow follow-through with limited volume expansion, suggesting buyers are cautious rather than aggressive. Although reclaiming $3,000 is symbolically important, Ethereum has repeatedly failed to build acceptance above this area since November, cementing it as a pivot rather than confirmed support.
From a structural perspective, ETH is stuck in a broad range roughly between $2,800 and $3,400. The lower limit attracted dip buyers, but the rally continued to stall before reaching previous collapse levels. This pattern reflects that the market is in balance, with neither bulls nor bears having enough confidence to force the trend.
Momentum indicators implied in price action point to a stabilization rather than a trend reversal. For Ethereum to revert back to a sustained upward trend, it will need to reclaim the $3,300-$3,500 region and stay above its long-term moving average with increasing volume.
Featured image from ChatGPT, chart from TradingView.com
editing process for focuses on providing thoroughly researched, accurate, and unbiased content. We adhere to strict sourcing standards and each page is diligently reviewed by our team of top technology experts and seasoned editors. This process ensures the integrity, relevance, and value of the content for readers.