

Bitcoin ($BTC) has officially entered a new bear market after suffering a massive 50% drop from its all-time high. Major cryptocurrencies have fallen to $60,000, hitting their lowest level since October 2024 and intensifying debate over how much further prices could fall before reaching the next long-term bottom.
As the market searches for direction, crypto market expert No Limit has shared a detailed framework outlining when and where he thinks Bitcoin could ultimately bottom out in this cycle.
Rather than focusing solely on price targets, No Limit argues that time plays an equally important role in identifying major turning points in Bitcoin's market cycle.
Bitcoin price likely to be low from October to November
According to His analysis shows that past Bitcoin bear markets have shown a relatively consistent pattern when measured from all-time highs to cycle lows. After the first halving in 2012, Bitcoin reached its bottom after 406 days.
The second halving cycle in 2016 bottomed out after 363 days, while the third halving cycle following the 2020 halving bottomed out after 376 days. In the current cycle following the 2024 halving, this process is not yet complete.
Based on these historical time frames, NoLimit believes there is a statistical likelihood that Bitcoin's next major capitulation point will occur between October and November 2026.
What the NUPL data suggests
In its analysis, NoLimit also focused on an institutional-grade on-chain metric known as Net Unrealized Gain and Loss (NUPL). Historically, Bitcoin has reached generational lows when NUPL enters an area known as the “Blue Zone.”
This signal successfully identified the bottom of the 2018 bear market, the COVID-19 crash, and the 2022 market low. According to NoLimit, Bitcoin has not yet entered this zone in the current cycle and is still some distance away from it.
Considering all factors, No Limit said he wouldn't be surprised if Bitcoin trades between $45,000 and $50,000 by the end of 2026, calling that range his ultimate downside target.
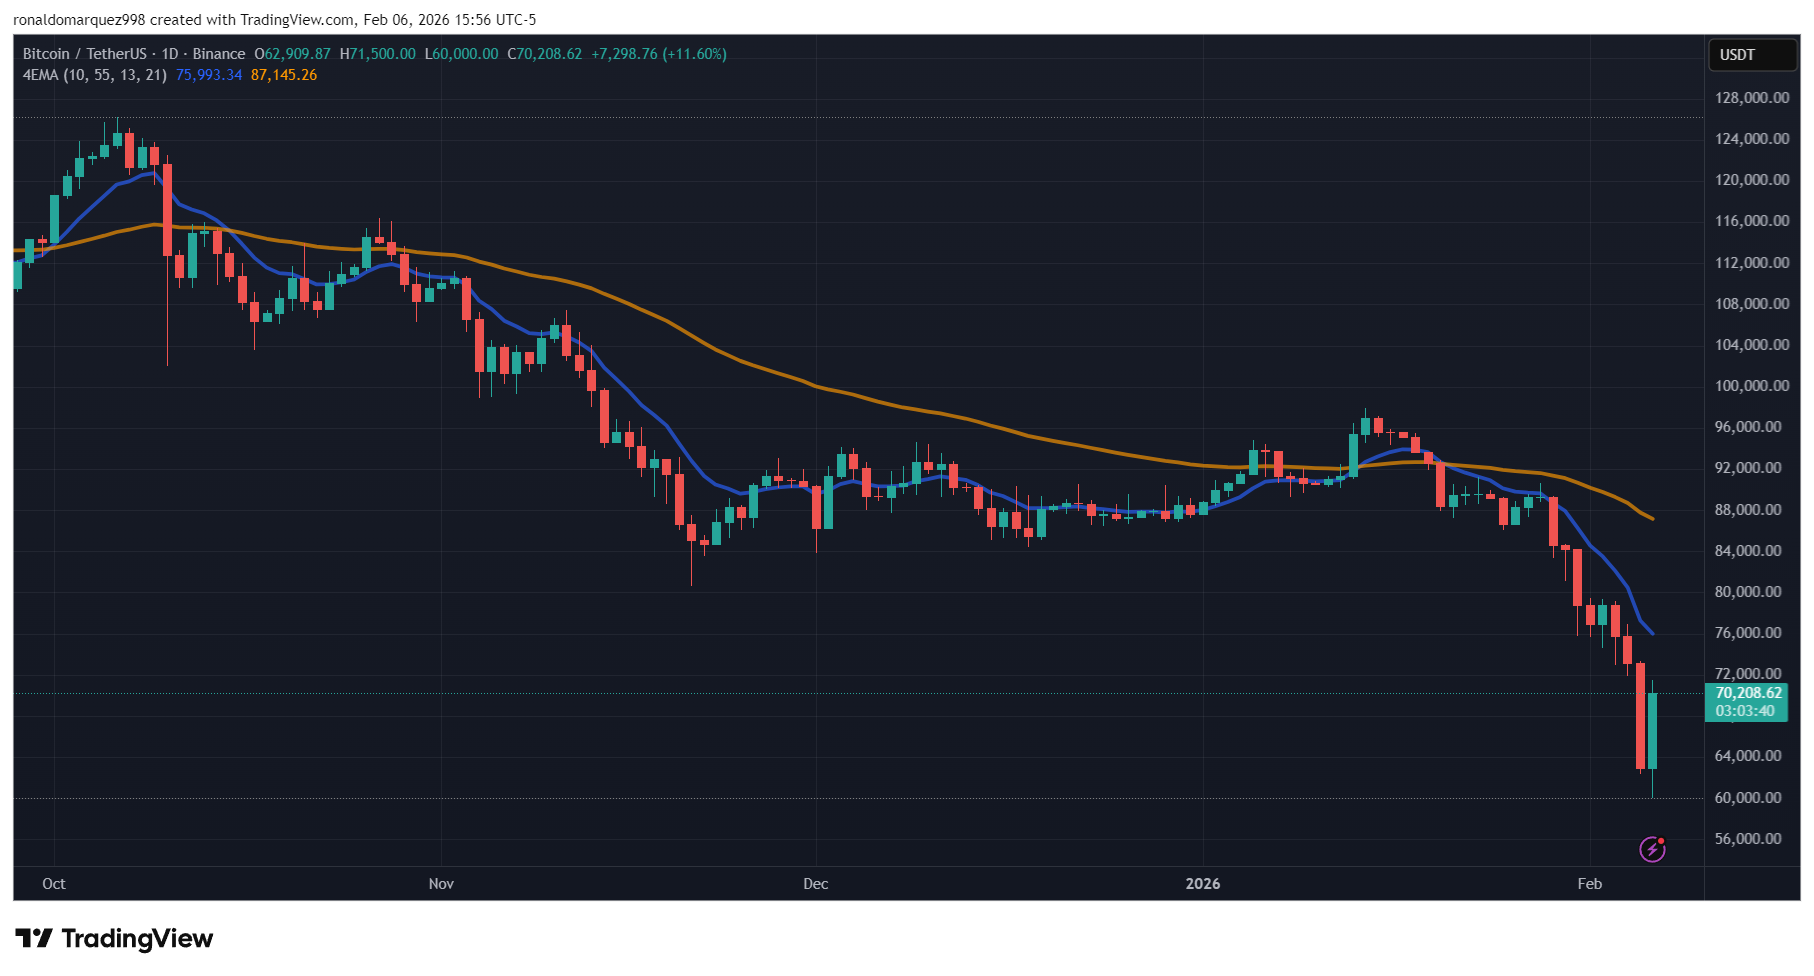
Featured image from OpenArt, chart from TradingView.com