

With futures outflows sweeping the market, Ethereum needs to break through key resistance levels to trigger a potential surge.
Ethereum (ETH), in particular, has fallen 3.7% in the past 24 hours and is currently trading at $3,202. During this period, the price fluctuated between $3,176.63 and $3,432.93, showing some volatility.
Despite the recent decline, Ethereum is up 0.6% over the past week and another 6.3% over the past 14 days. However, its past 30-day and 12-month performance show significant challenges, with losses of 9.6% and 12.5%, respectively.
Considering the current price range and broader market trends, Ethereum is at a critical juncture. The recent decline raises the following concerns: ETH can be maintained Current value and respectability will further decline.
Ethereum price analysis
On the technical side, the current Ethereum price on the 4-hour chart shows a slight increase. Wide Bollinger Bands indicate volatility, and while the price has recently broken above the upper band, it hasn't been strong enough to push higher.
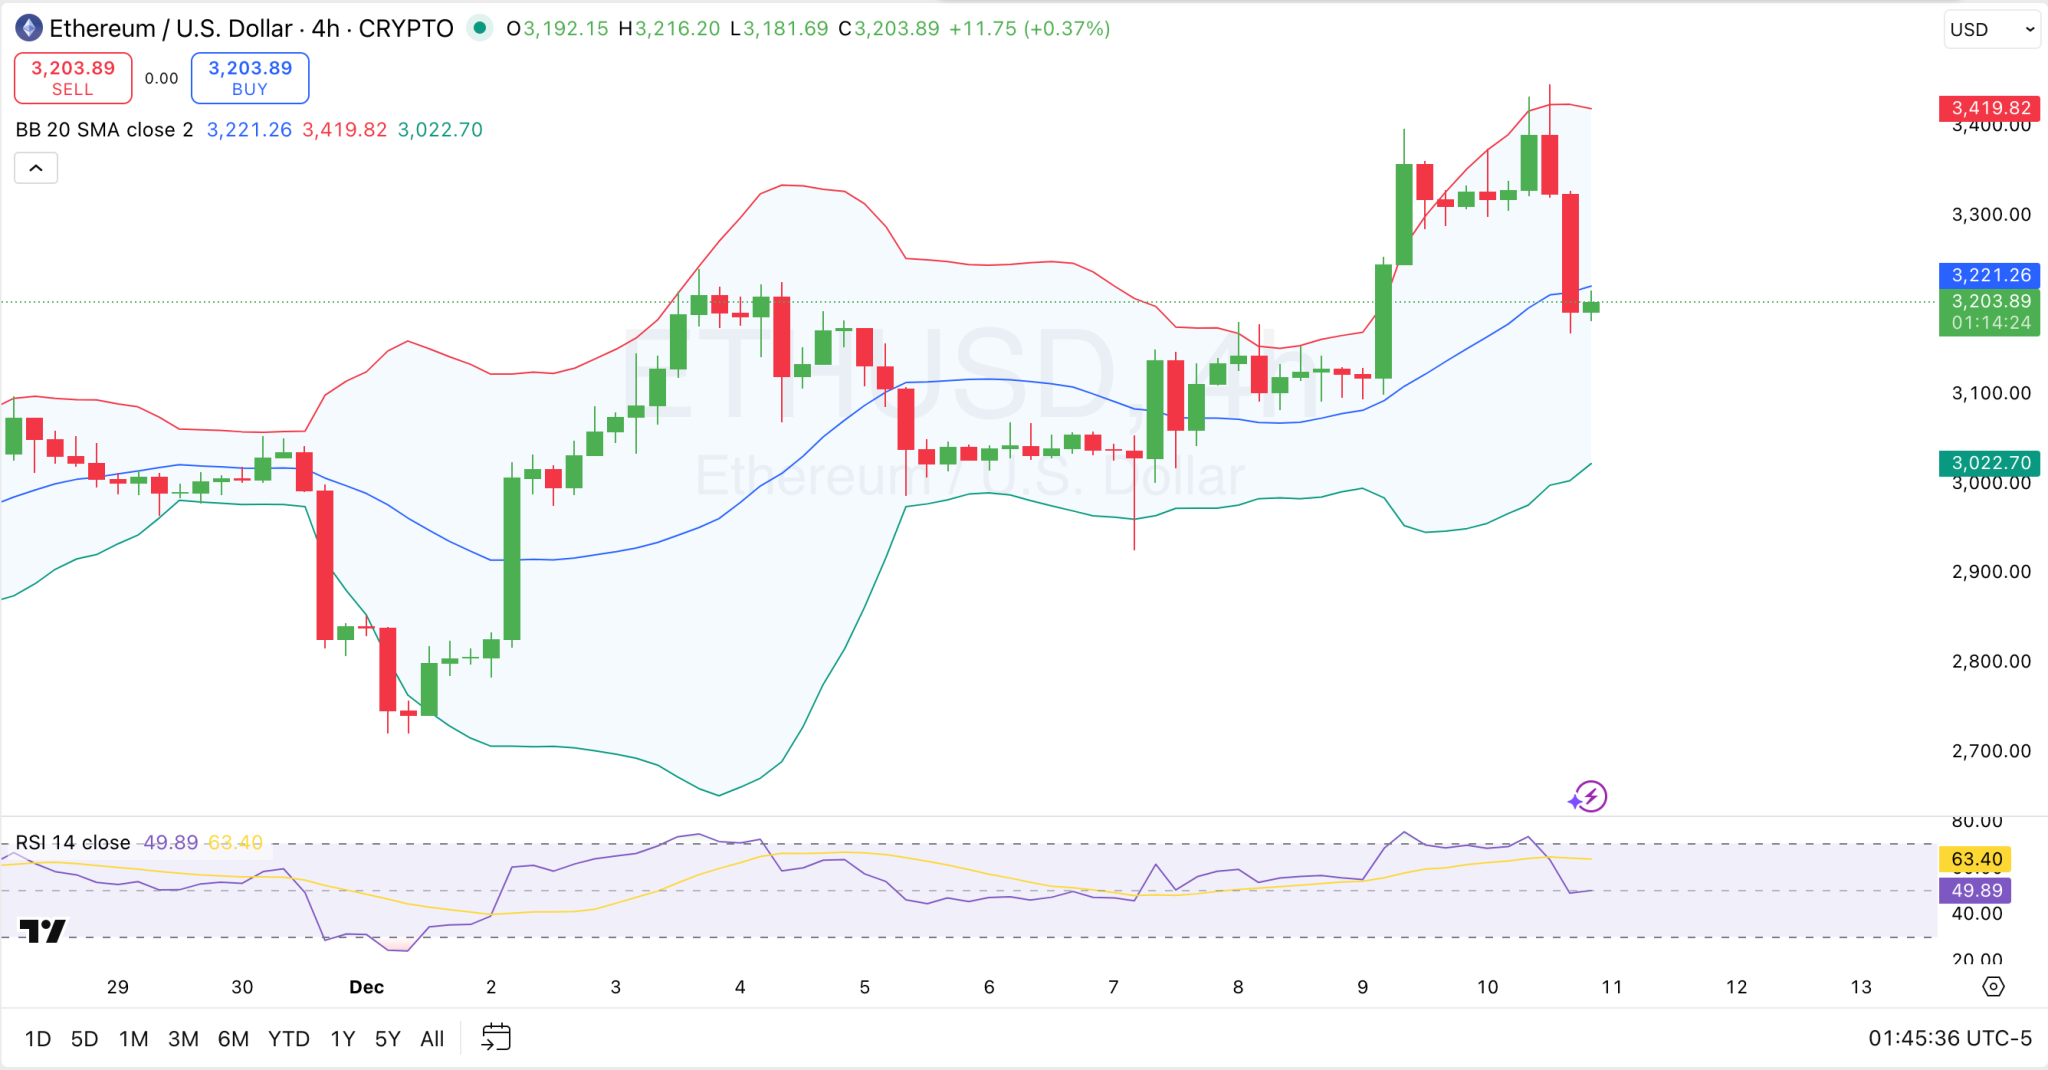
Ethereum 4 hour chart
After this break, the price has rebounded slightly and is now hovering just below the central Bollinger Band, currently at $3,221. The range between $3,221 and its lower bound at $3,022.70 indicates near-term support and resistance. If Ethereum fails to break out of the $3,221 resistance, it could face further consolidation or a pullback to the $3,022 support level.
The RSI (Relative Strength Index) is 63.40, suggesting that Ethereum is neither overbought nor oversold. However, it indicates there is room for upside, depending on whether the price breaks through the current resistance at $3,221.
If Ethereum breaks out of this level, the next major resistance zone lies around the upper Bollinger Bands at $3,419.82. Conversely, if Ethereum declines and breaks below the $3,022 support level, it could indicate a deeper retracement to lower price levels.
ETH futures flow
Elsewhere, inflows and outflows data Shows important market activity over different time frames. In the past hour, there were notable outflows of $511.47 million, outpacing inflows of $411.35 million, for a net inflow of $101.12 million, a plunge of 164.25%.
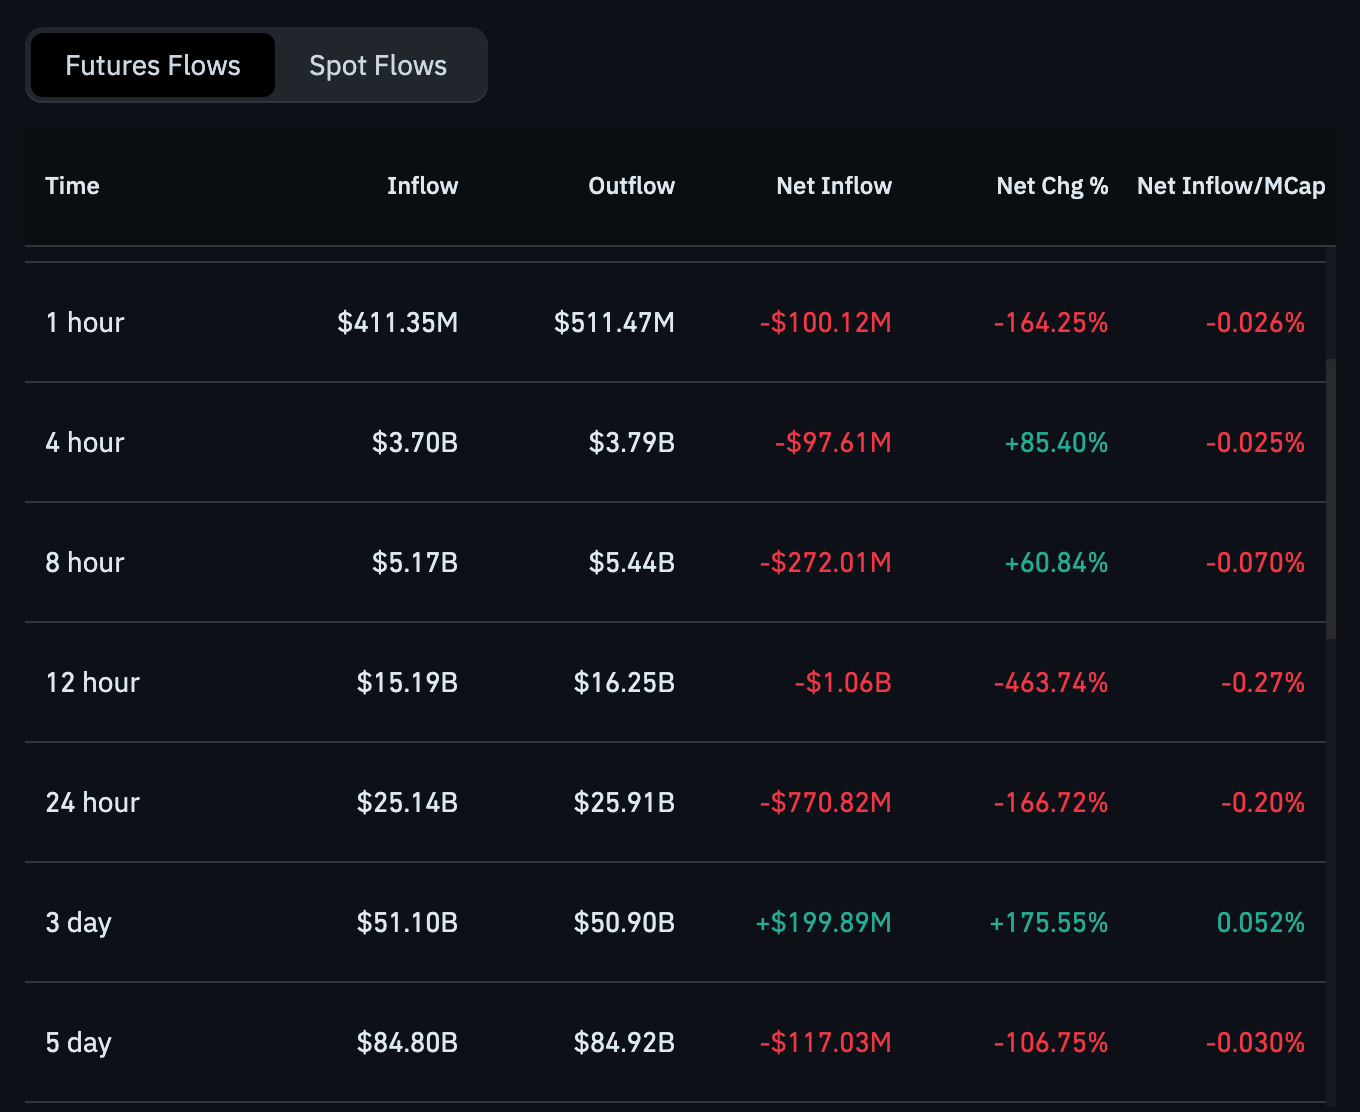
Ethereum futures flow
This suggests potential bearish sentiment in the short term. The 4-hour data shows a similar imbalance with inflows of $3.7 billion and outflows of $3.79 billion, resulting in a negative net inflow of $97.61 million, but a +85.40% change in inflows, indicating some recovery in the market.
Looking at longer time frames, 8-hour, 12-hour, and 24-hour data also show mixed results, indicating that inflows are slightly more favorable at certain points, but are followed by outflows, suggesting that the market continues to struggle. The 12-hour data shows a significant net outflow of $1.06 billion (-463.74%) despite inflows of $15.19 billion.
However, on a three-day timescale, net inflows were positive with inflows of $51.1 billion, an increase of +175.55%. This suggests that more money is flowing into the futures market despite short-term volatility.