

Ethereum price is trading around $3,195 today after a significant rejection at the $3,350 zone where multiple resistance levels were concentrated. The pullback forced ETH back into a tight range as outflows surged again and buyers tried to protect the uptrend line that had supported the price since last week.
Outflows soar as traders reduce exposure
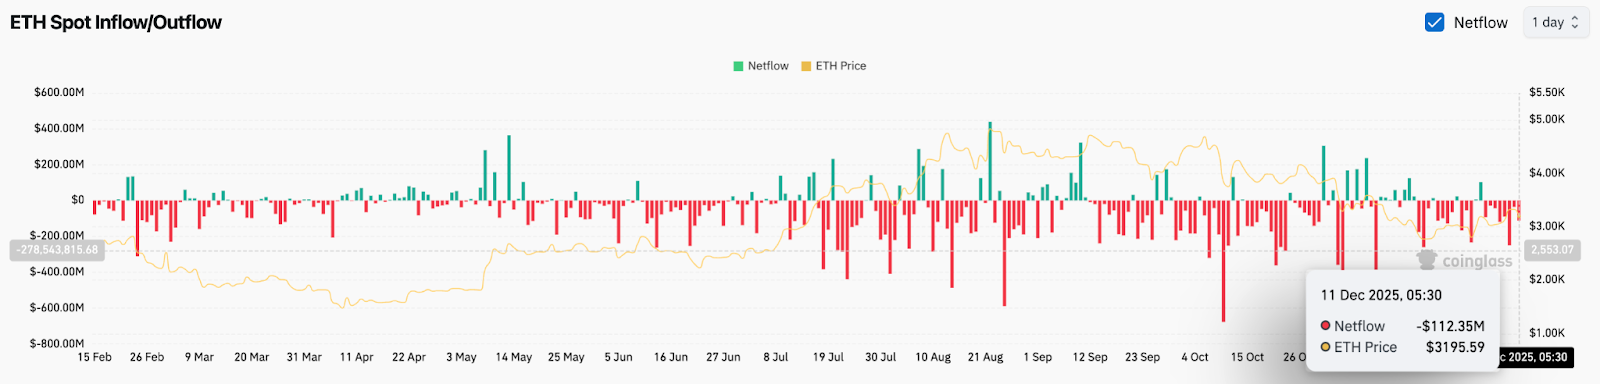
ETH Netflows (Source: Coinglass)
According to Coinglass, ETH recorded net outflows of over $112 million on December 11th. Capital outflows continue a pattern that has lasted several months, with large red marks dominating the board in both October and November.
A large outflow of money upon a rejection of a major resistance often means that buyers are not motivated to chase the breakout. That's what happened here. ETH approached a technical tipping point but was unable to break through, and traders responded by pulling liquidity from exchanges.
Related: XRP Price Prediction: XRP Range Tightens as Outflow Continues…
The recent decline in broader market sentiment has added to that pressure. Bitcoin is also slowing down, so large holders remain cautious. Until the outflow cools, the bounce will face resistance before regaining the upper band of the range.
Whale rotation adds an emotional twist
In the past two weeks, the whale sold $132,570,000 in $BTC and bought $140,200,588 in $ETH.
It appears that whales are starting to take an interest in Ethereum again. pic.twitter.com/6f1cm8MwyT
— Ted (@TedPillows) December 11, 2025
Despite the leak, the data on the chain shows some interesting changes. In the past two weeks, whales have sold $132 million worth of Bitcoin and bought more than $140 million in Ethereum. This type of rotation typically indicates an early attempt to take a position ahead of a potential trend change.
One whale alone doesn't change the structure, but it does add an interesting layer. This shows that big capital is closely monitoring the current level of ETH. Once prices stabilize, this type of activity could form the basis of a larger accumulation zone.
Rejection at $3,350 confirms strong multi-layer resistance
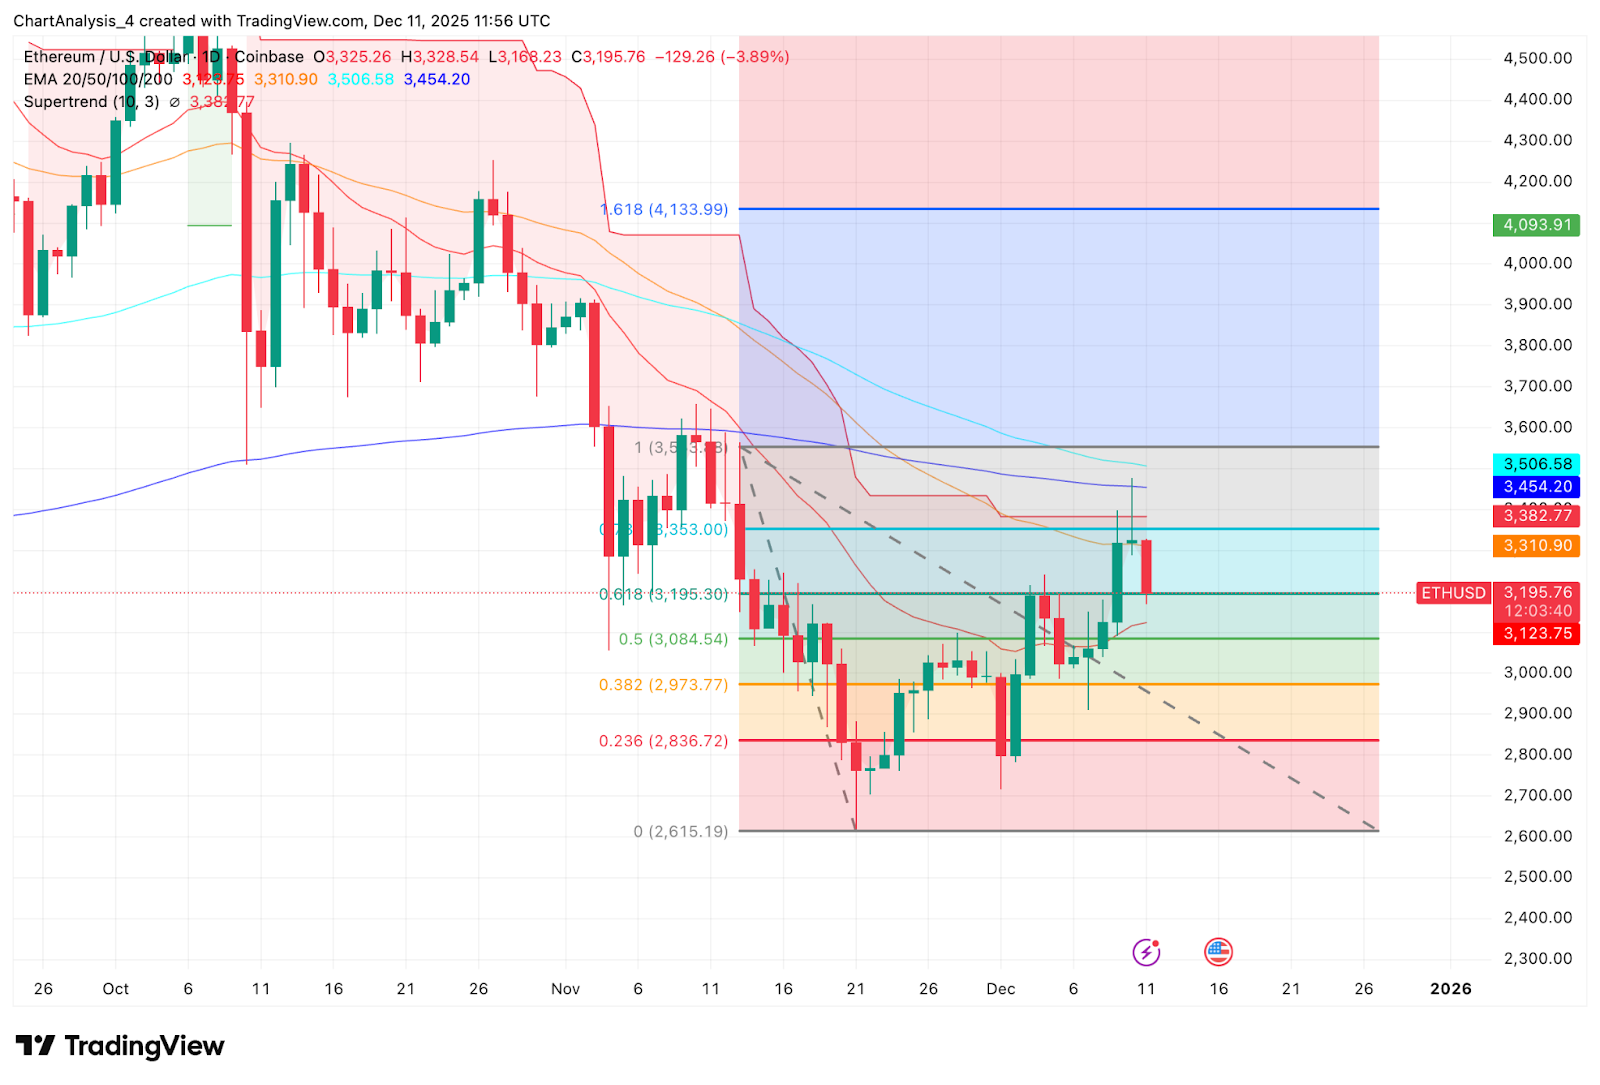
ETH price fluctuation (Source: TradingView)
The daily chart shows how the price was rejected cleanly in the $3,350 area. This zone includes:
- 50EMA
- 100EMA
- upper bollinger bands
- 0.786 Fibonacci Retracement
ETH briefly penetrated the cluster, but was pushed back within hours. I found that the candle had a long wick printed on it, which clearly indicated that it was sourced from the seller.
Due to this rejection, ETH is currently stuck near the 0.618 level near $3,195, which is acting as short-term support. Losing this level exposes $3,084 and then $2,973, matching the 0.5 and 0.382 Fibonacci levels. These are the next demand zones that traders will focus on during a pullback.
Related: Bitcoin Price Prediction: BTC Remains Near $90,000 as Market Waits…
The supertrend indicator also remains bearish and is trading above price, confirming the downward pressure that has prevailed since November.
Trendline support still holds, but momentum is weak
ETH price dynamics (Source: TradingView)
On the 30-minute chart, ETH is clinging to the uptrend line that has guided its recent recovery. Price has tapped this line several times today, indicating that it is an active support level.
Parabolic SAR reversed bearishly during the decline but has not yet reversed and the signal momentum remains weak. With the RSI sitting around 34, ETH remains close to oversold territory, but there is no strong reversal signal.
For buyers to regain short-term control, ETH will need to regain the $3,240-$3,260 region where the collapse began. That region coincides with the midpoint of the bottom of the SAR flip and the final push.
If ETH fails to rebound cleanly from the trendline, the next test will be the $3,175 area. A break below this level could accelerate the selloff towards $3,084.
outlook. Will Ethereum go up?
If the trend line holds and buyers defend the 0.618 level, ETH still has a chance to stabilize. A rebound to $3,260 will be the first sign of strength. A follow-through above $3,350 will confirm the return of momentum.
If ETH falls below $3,175, sellers will regain full control and the market will move into a deeper correction towards the $3,000 area.
Above $3,350, it is ready for a recovery. A break below $3,175 will turn the trend bearish again.
RELATED: 2025-2030 NIGHT Price Prediction: Can New Privacy Layer Sustain Early Breakout?
Disclaimer: The information contained in this article is for informational and educational purposes only. This article does not constitute financial advice or advice of any kind. Coin Edition is not responsible for any losses incurred as a result of the use of the content, products, or services mentioned. We encourage our readers to do their due diligence before taking any action related to our company.